
Last analysis expected upwards movement for Monday’s session which is not what happened. Price remains above the invalidation point on the hourly chart, but this movement does not look impulsive. It looks corrective.
I have a new weekly alternate wave count for you today.
Click on the charts below to enlarge.
Main Wave Count.
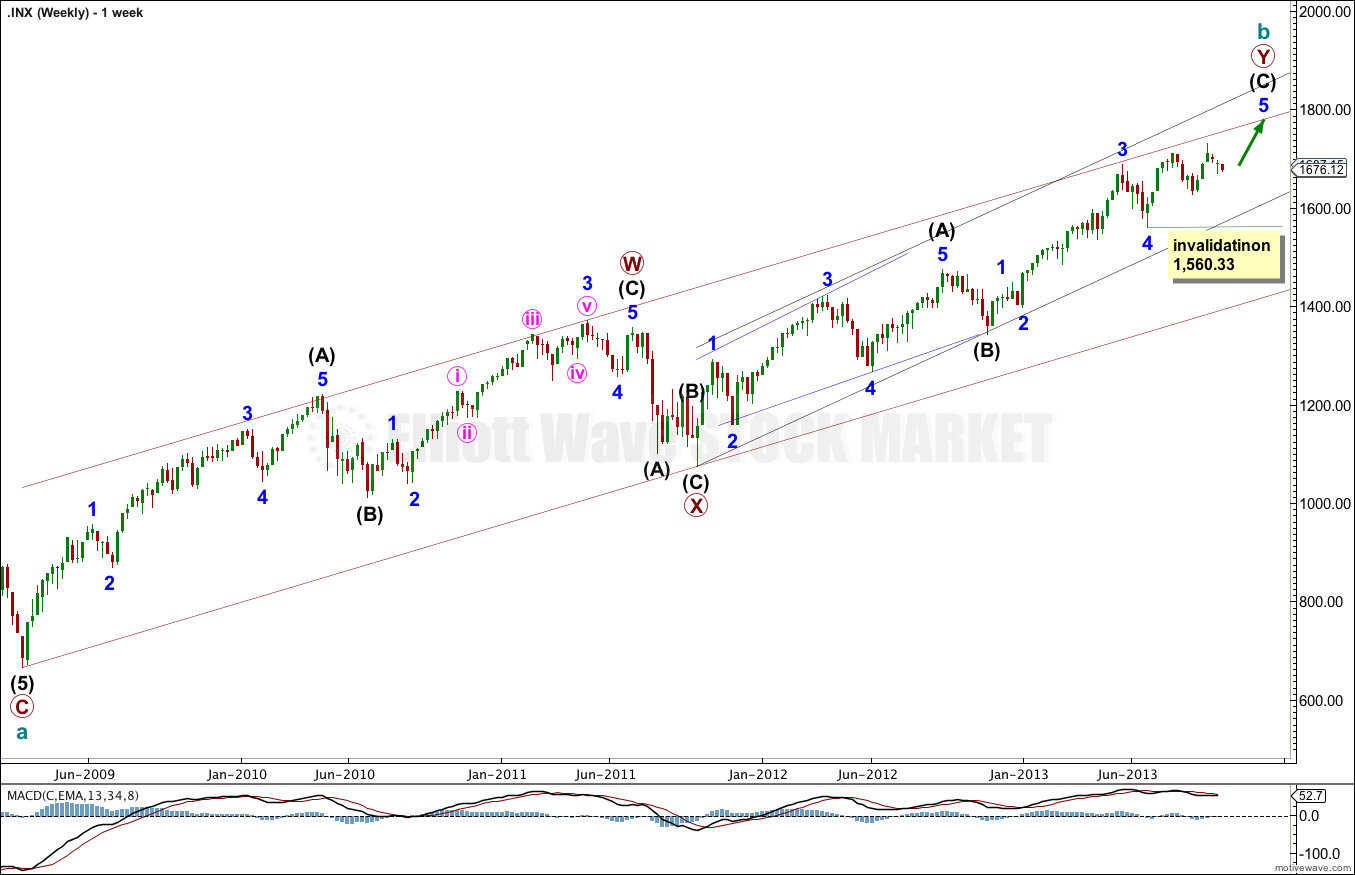
This has been my main wave count for a long time now.
Because the first wave upwards from the low at 666.79 looks strongly like a three wave structure, this main wave count sees cycle wave b as a double zigzag.
Within the second zigzag of primary wave Y intermediate wave (C) is incomplete, and minor wave 5 is incomplete.
Within minor wave 5 no second wave correction may move beyond the start of the first wave. This wave count is invalidated with movement below 1,560.33.
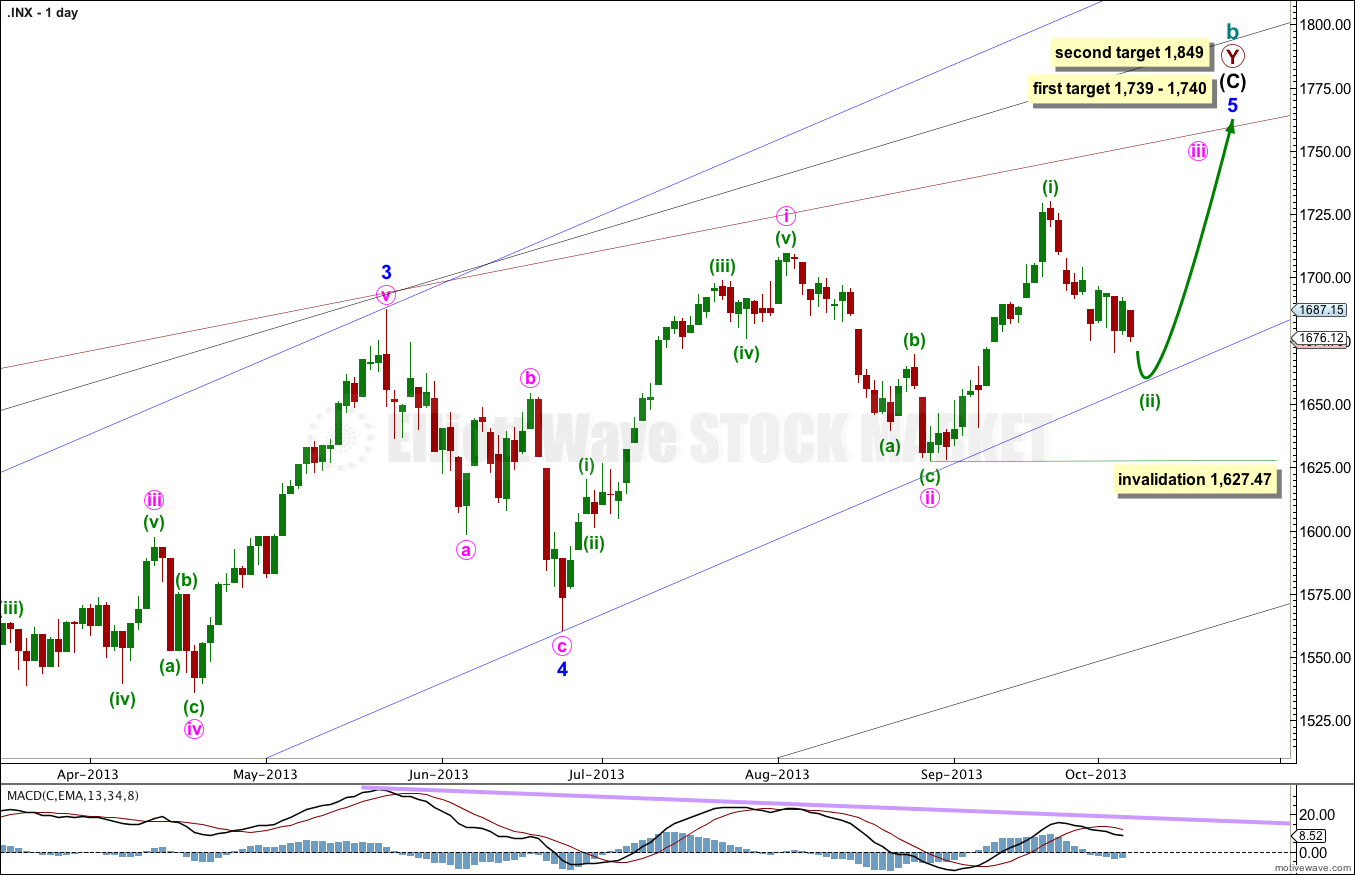
At 1,740 intermediate wave (C) would reach equality with intermediate wave (A). At 1,739 minor wave 5 would reach 0.618 the length of minor wave 3.
If price rises through this first target the next target will be used. At 1,849 minor wave 5 would reach equality with minor wave 3.
When minute waves iii and iv within minor wave 5 are complete I will add to the target calculation at minute wave degree, so at that stage it may change.
Minor wave 1 lasted a Fibonacci 21 days, minor wave 2 lasted a Fibonacci 8 days, minor wave 3 has no Fibonacci duration at 98 days, and minor wave 4 lasted 22 days, just one day longer than a Fibonacci 21.
Minor wave 5 may not exhibit a Fibonacci time relationship. The next possibility may be the 29th of October (give or take two days either side of this date) where minor wave 5 would have lasted a Fibonacci 89 days. This is a date to look out for, but cannot be relied upon because Fibonacci time relationships do not occur often enough to be reliable.
Keep drawing the wider parallel channels from the monthly chart and copy them over to the daily chart.
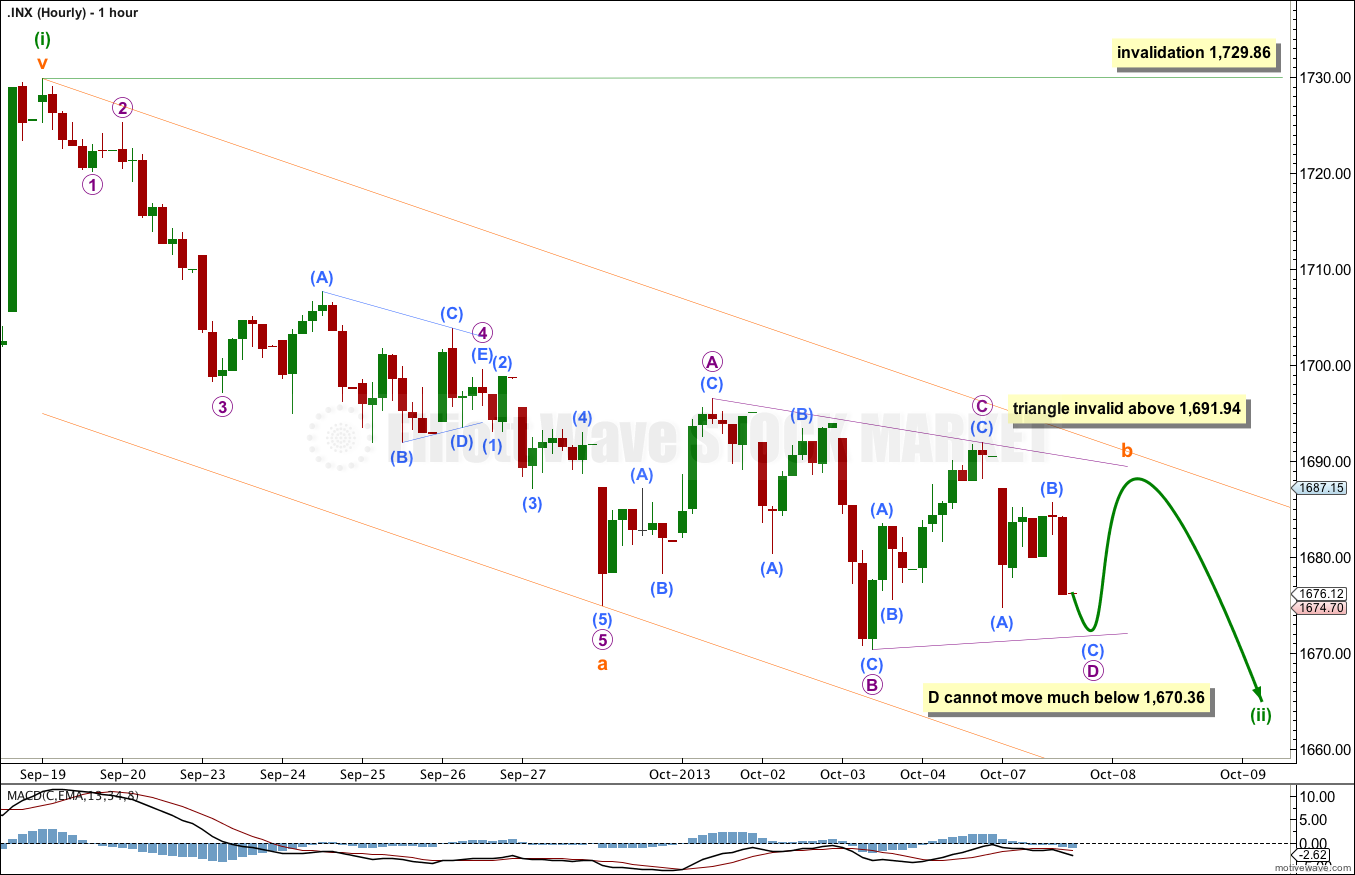
Monday’s session subdivides into fives down and a three up (labeled submicro wave (B) ). This indicates more downwards movement to come. It may be that subminuette wave b is an incomplete running triangle.
Within a contracting triangle subwave D may not move beyond the end of subwave B. Within a barrier triangle subwave D should end about the same level as subwave B, and may end slightly below 1,670.36, but not by too much, as the B-D trend line should be essentially flat.
Within a contracting or barrier triangle subwave E may not move beyond the end of subwave C. This triangle is invalidated with movement above 1,691.94.
If the triangle is invalidated with movement above 1,691.94 then a double combination may be completing for subminuette wave b.
When subminuette wave b is complete then I would expect a five wave structure downwards for subminuette wave c. When subminuette wave b is complete I can calculate a target for subminuette wave c, which is most likely to be about 34 points in length.
Subminuette wave b may not move beyond the start of subminuette wave a. This wave count is invalidated with movement above 1,729.86.
Alternate Wave Count.
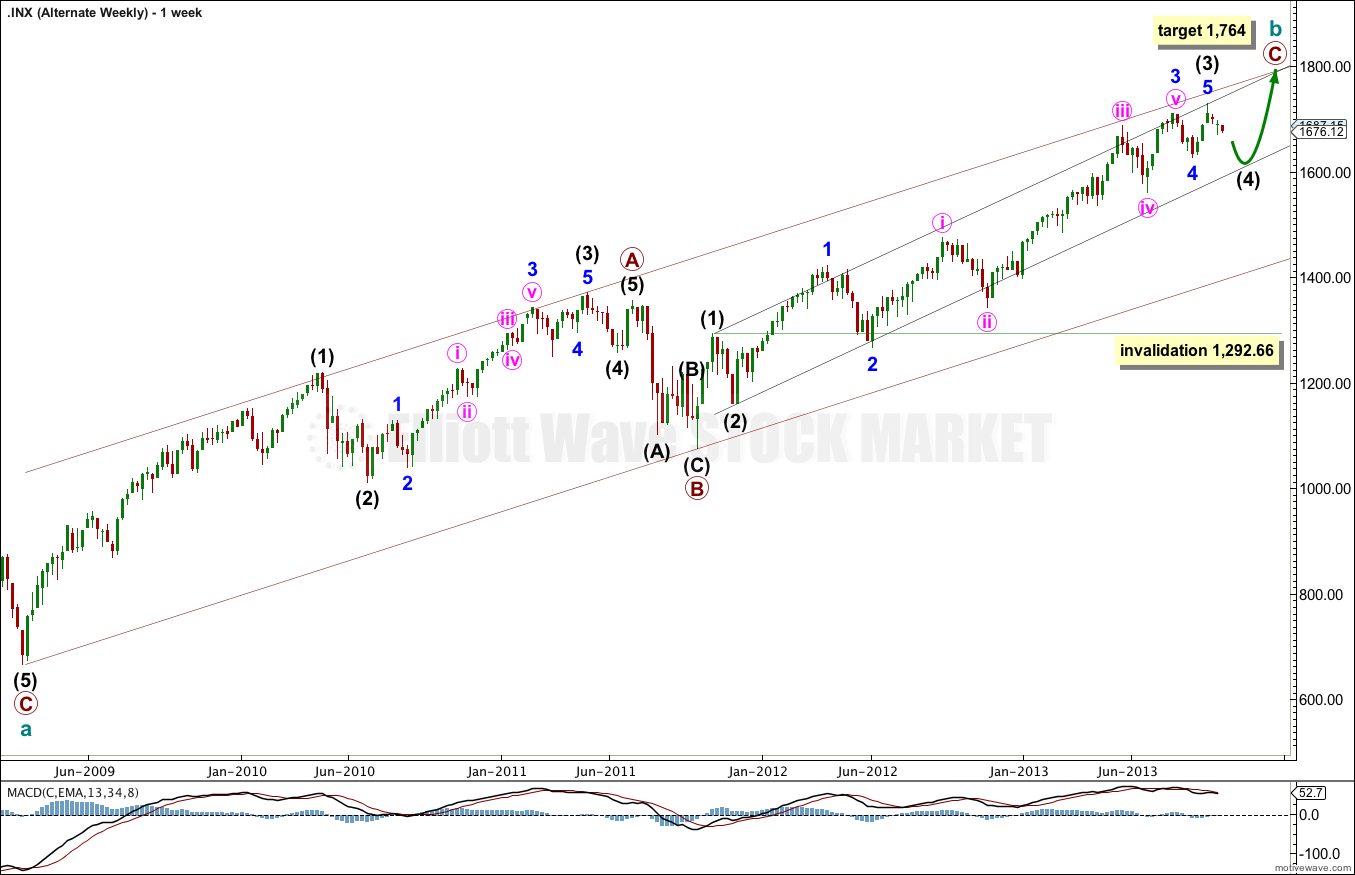
I am considering this alternate because recent movement on the S&P for the last few weeks looks like a series of fourth and fifth waves, not first and second waves.
This alternate has the main difference from the main wave count in the first wave up from the low at 666.79. This alternate must see this upwards wave as a five wave impulse. This is possible, but overall does not have as good a look as seeing it as a three.
If the first wave up labeled primary wave A is a five wave impulse, then cycle wave b is a single zigzag. Now the recent movement fits very nicely as a series of fourth wave corrections.
At 1,764 primary wave C would reach equality with primary wave A.
Intermediate wave (4) may not move into intermediate wave (1) price territory. This wave count is invalidated with movement below 1,292.66.
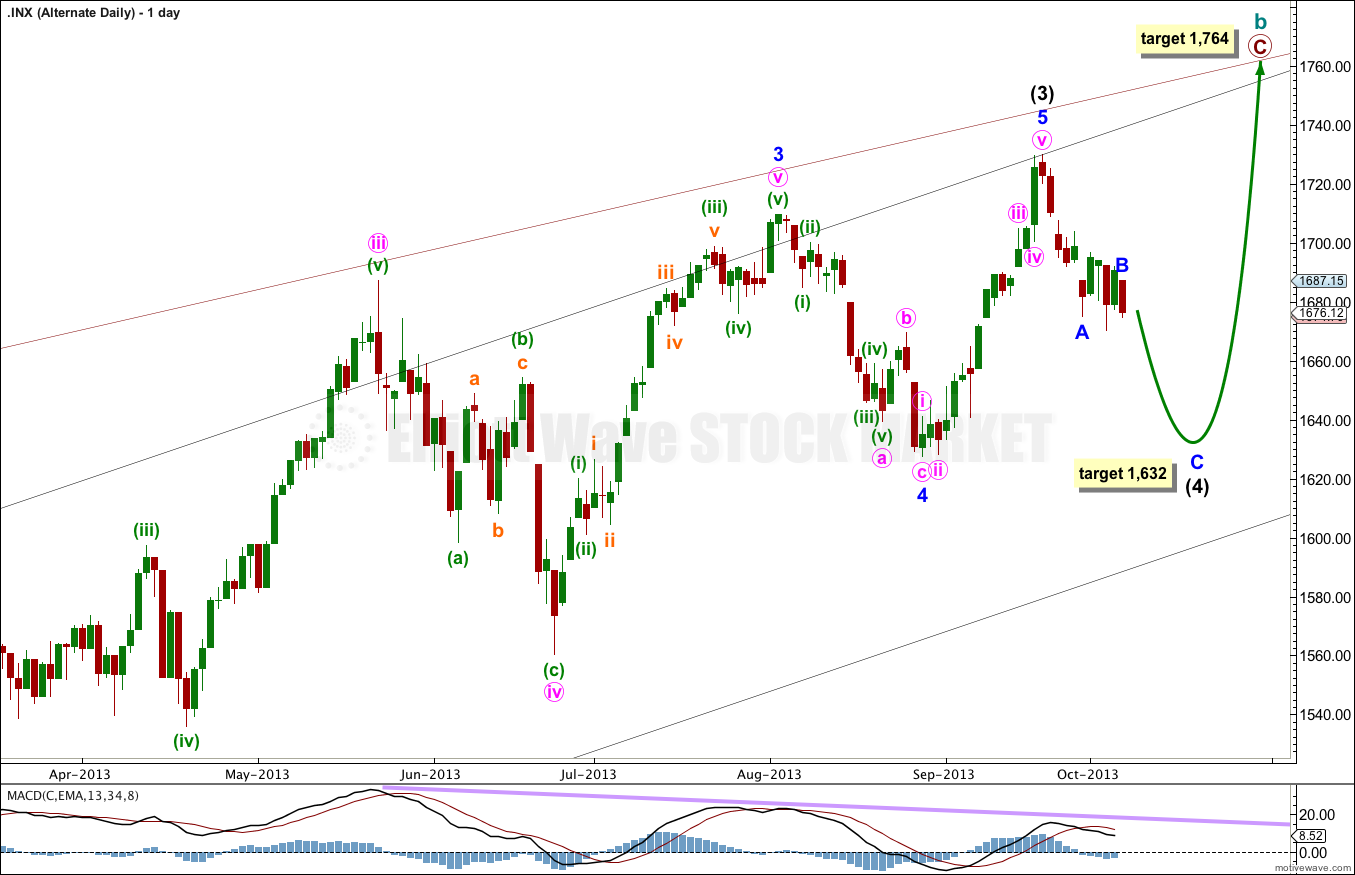
For this alternate I would expect several days to a couple of weeks of more downwards movement. Intermediate wave (2) lasted 20 days. So far intermediate wave (4) has lasted 12 days. In another 8 days it will be proportional to intermediate wave (2).
At bbout 1,632 minor wave C would reach equality in length with minor wave A. If minor wave B moves higher this target must move correspondingly higher also.
I would expect intermediate wave (4) to find support at the lower edge of the black parallel channel.
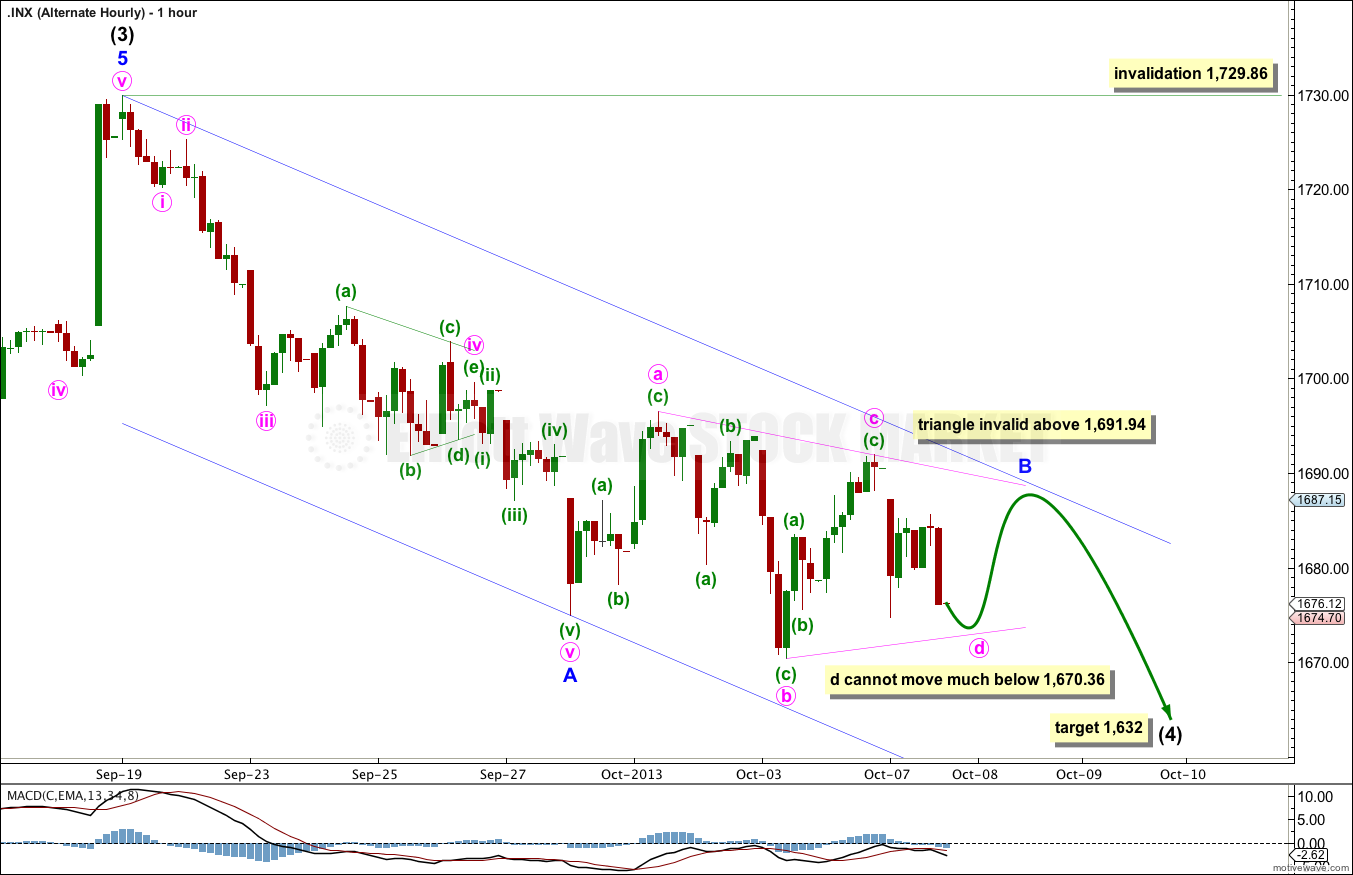
This alternate hourly wave count has exactly the same subdivisions as the main hourly chart, but instead of a zigzag down for a second wave this wave count sees it as a zigzag down for a fourth wave.
Thank you very much.