
Movement below 6,386.72 invalidated last week’s FTSE analysis. This can only be a continuation of a second wave, which is likely to reach down to the 0.618 Fibonacci ratio of the first wave.
Click on the charts below to enlarge.
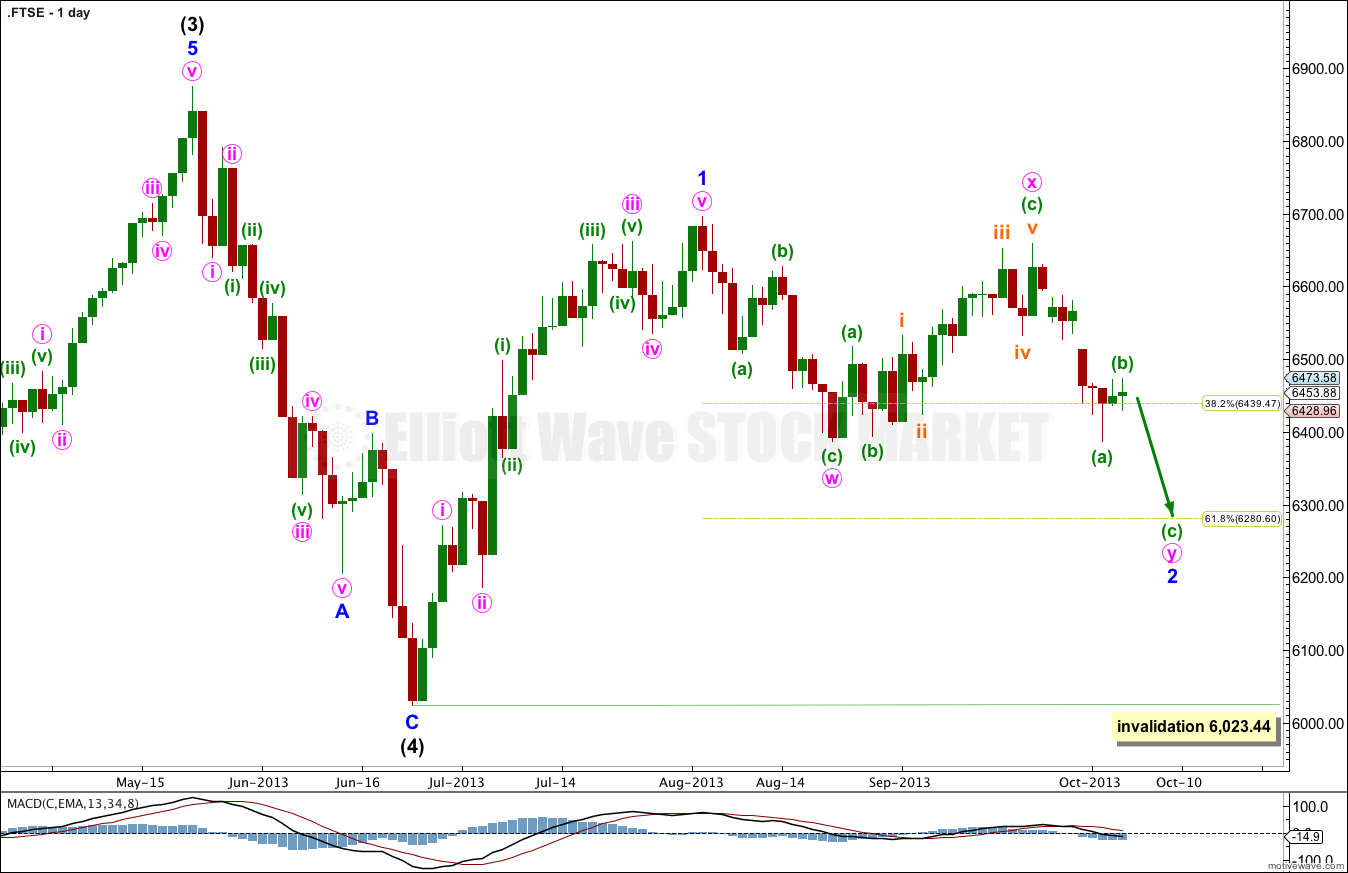
Within intermediate wave (4) it is possible to see this structure as a completed zigzag.
The following upwards movement for minor wave 1 of intermediate wave (5) is ambiguous. It can be seen as either a three or a five. This wave count sees it as a five.
Downwards movement for minor wave 2 is an incomplete double zigzag. It cannot be a flat because what would be wave B (here labeled minute wave x) is less than 90% of what would be the A wave (here labeled minute wave w).
The purpose of double zigzags is to deepen a correction when the first zigzag did not move price deep enough. Minor wave 2 would be likely to end about the 0.618 Fibonacci ratio of minor wave 1 at 6,280.60.
Minor wave 2 may not move beyond the start minor wave 1. This wave count is invalidated with movement below 6,023.44.
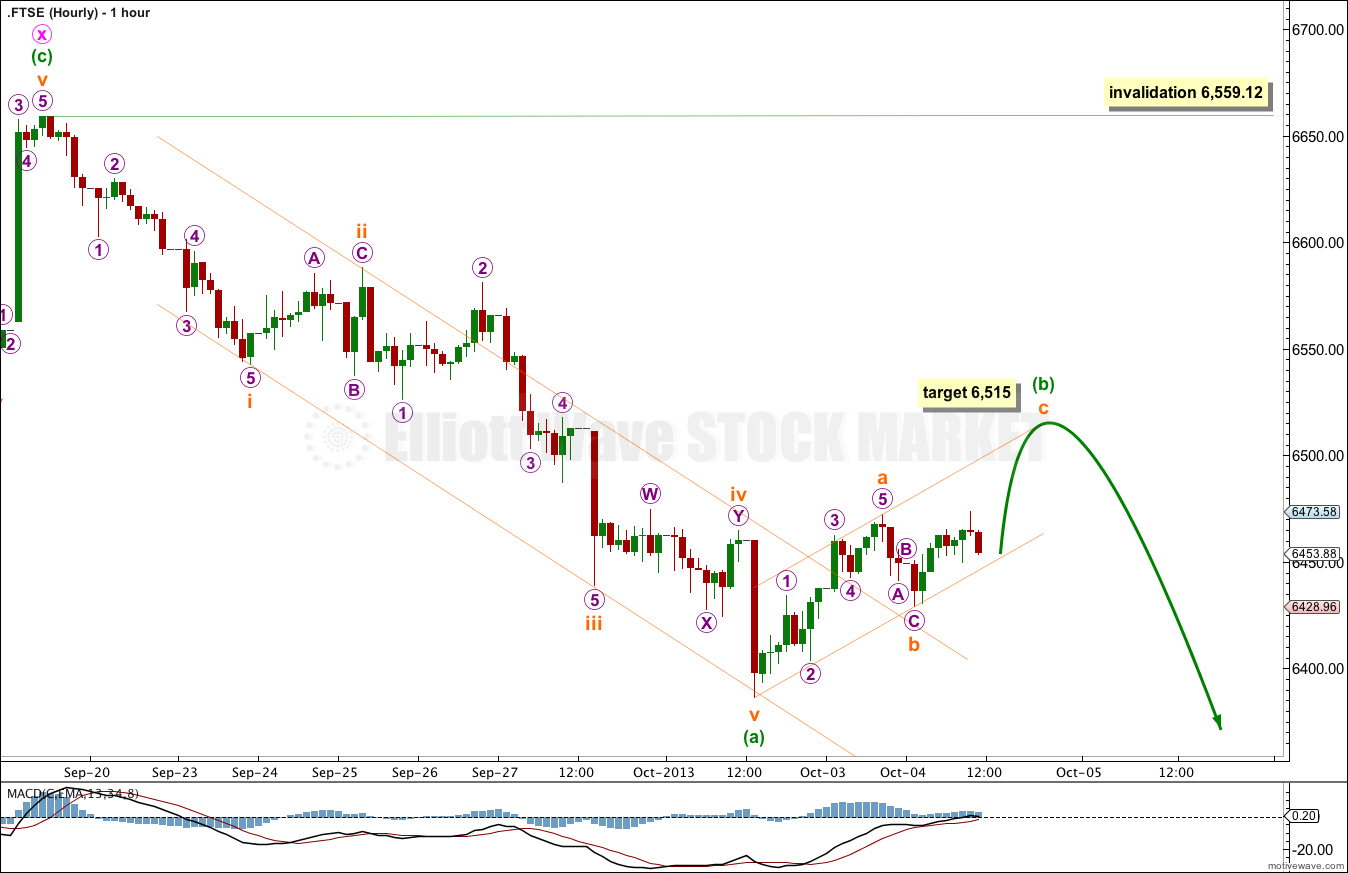
Within the second zigzag of this double minuette wave (a) is complete, and a channel drawn about it is clearly breached by upwards movement.
Minuette wave (b) may be an incomplete zigzag. At 6,515 subminuette wave c would reach equality with subminuette wave a.
I would expect subminuette wave c to find resistance at the upper edge of the small channel drawn about minuette wave (b). When this channel is breached by subsequent downwards movement then I would expect that minuette wave (c) may have begun.
When minuette wave (b) is complete I would expect downwards movement to new lows for minuette wave (c).
Minuette wave (b) may not move beyond the start of minuette wave (a). This wave count is invalidated in the short term with movement above 6,559.12.