
Yesterday’s analysis expected one small upwards wave to a short term target at 1,701 before a short term trend change and downwards movement. However, price just moved lower.
The structure at the hourly chart level is different for today’s analysis, but the daily chart remains the same.
Click on the charts below to enlarge.
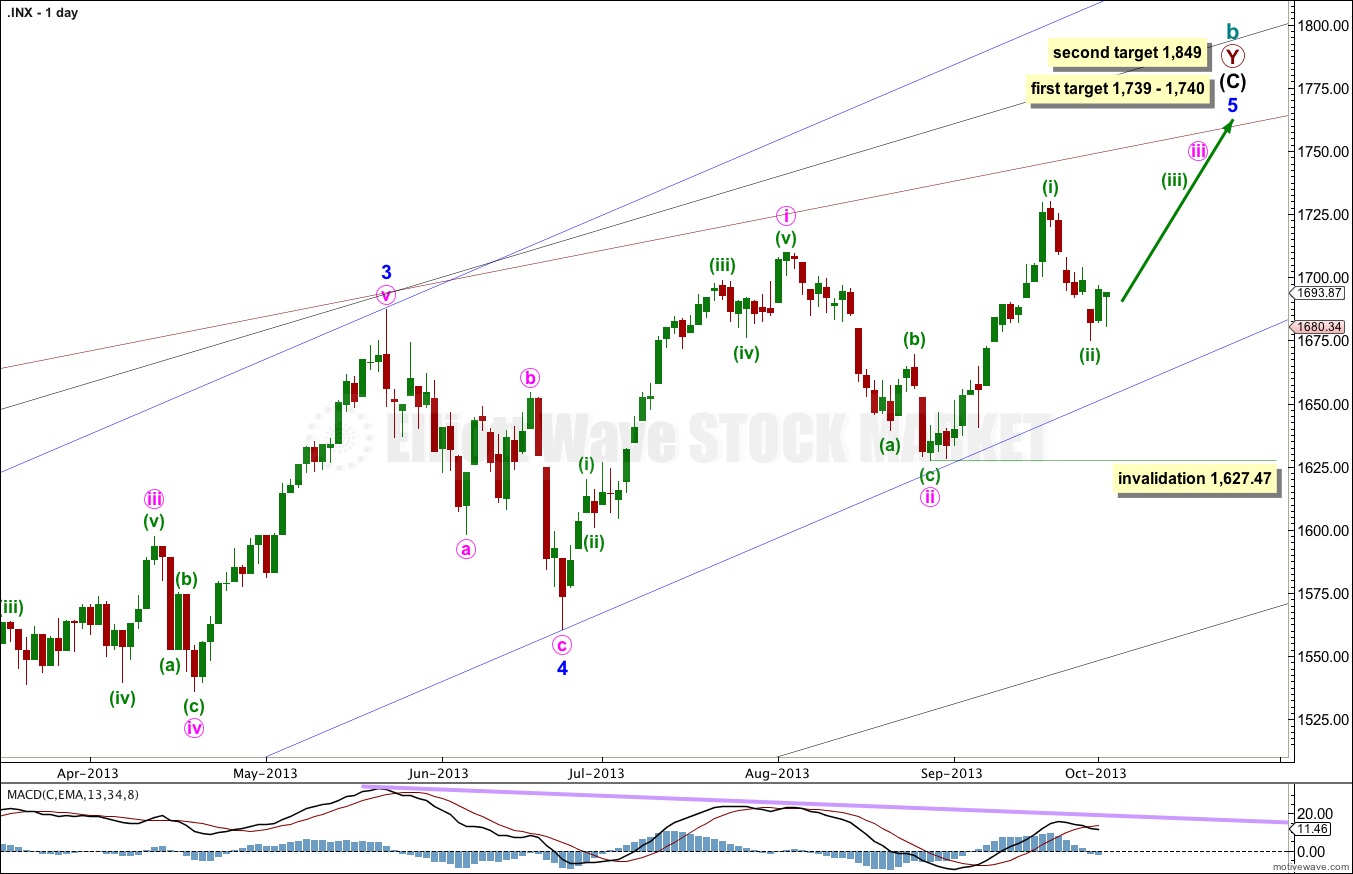
At 1,740 intermediate wave (C) would reach equality with intermediate wave (A). At 1,739 minor wave 5 would reach 0.618 the length of minor wave 3.
If price rises through this first target the next target will be used. At 1,849 minor wave 5 would reach equality with minor wave 3.
When minute waves iii and iv within minor wave 5 are complete I will add to the target calculation at minute wave degree, so at that stage it may change.
Minor wave 1 lasted a Fibonacci 21 days, minor wave 2 lasted a Fibonacci 8 days, minor wave 3 has no Fibonacci duration at 98 days, and minor wave 4 lasted 22 days, just one day longer than a Fibonacci 21.
Minor wave 5 may not exhibit a Fibonacci time relationship. The next possibility may be the 29th of October (give or take two days either side of this date) where minor wave 5 would have lasted a Fibonacci 89 days. This is a date to look out for, but cannot be relied upon because Fibonacci time relationships do not occur often enough to be reliable.
Keep drawing the wider parallel channels from the monthly chart and copy them over to the daily chart.
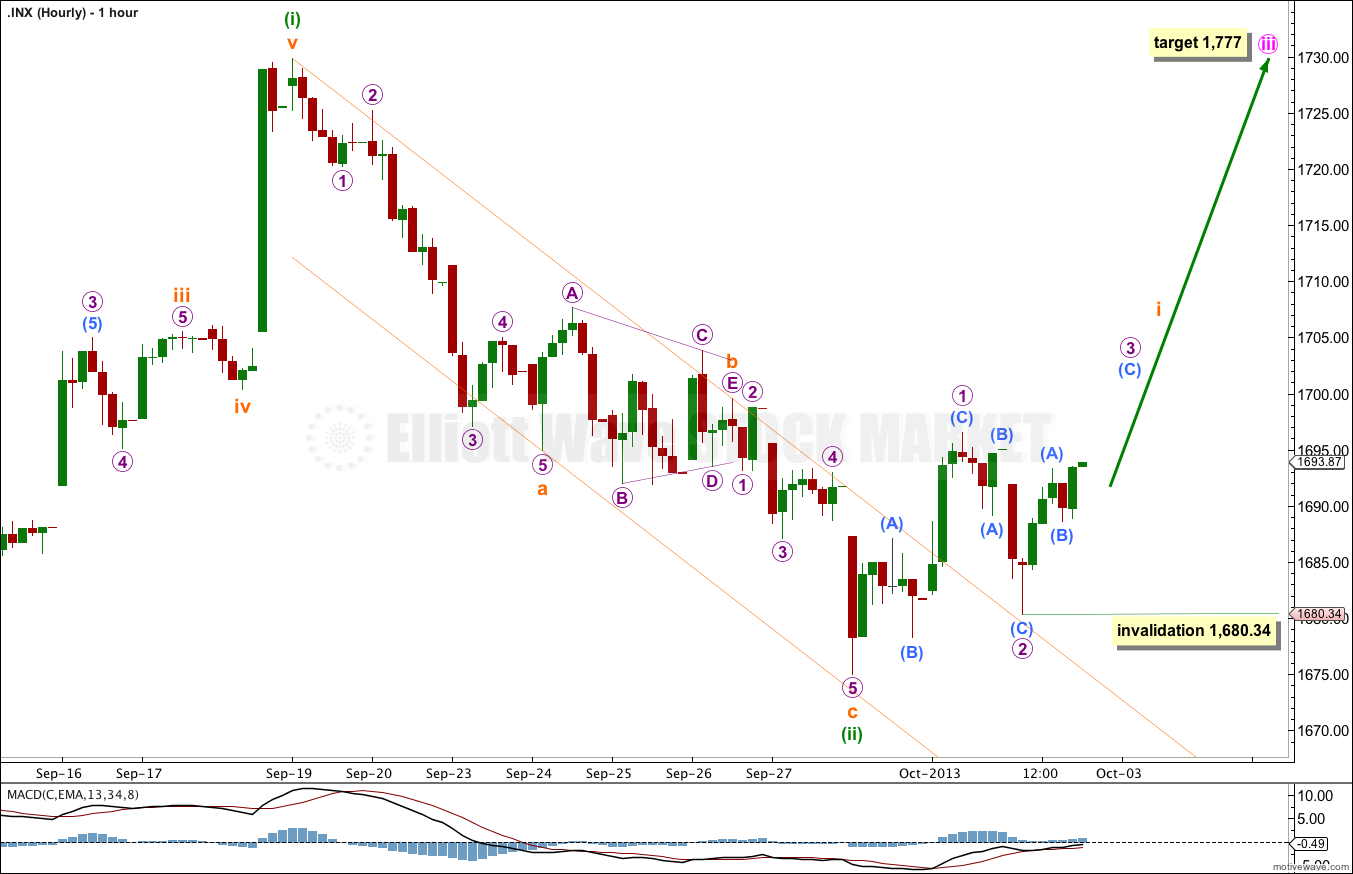
Because there was no final fifth wave up as was expected yesterday, this leaves the upwards movement labeled micro wave 1 as a three wave structure.
There are two possibilities for a first wave: either a simple impulse which is most common or a leading diagonal which is less common. Leading diagonals have second and fourth waves which must subdivide as zigzags; the first, third and fifth waves are most commonly zigzags but may also be impulses.
We may be seeing a leading diagonal unfolding in this first wave position for subminuette wave i. Micro wave 2 is a 0.75 correction of micro wave 1 which is in the typical range for a second wave within a diagonal of 0.66 to 0.81.
Micro wave 3 is most likely to unfold as a zigzag, but it may also be an impulse. When it is completed the following wave of micro wave 4 must overlap back into micro wave 1 price territory, but may not move beyond the end of micro wave 2. This wave count is invalidated with movement below 1,680.34.
The mid term target remains the same. At 1,777 minute wave iii would reach equality in length with minute wave i.
Hi Lara,
how can Micro wave 1, in subminuette wave i be a 3-wave structure – I thought wave 1’s all had to be five waves?
Because it’s a leading diagonal. The subdivisions for diagonals are different.
For leading diagonals waves 2 and 4 can only be zigzags, waves 1, 3 and 5 are most commonly zigzags but may also be impulses.
For ending diagonals all the sub waves must be zigzags.
Not correct, leading diagonals must be 5 waves structures. Wave 1’s must be 5 wave structures
seriously???
“Elliott Wave Principle” by Frost and Prechter, 10th edition, page 87:
“waves 1, 2, 3, 4 and 5 of an ending diagonal, and waves 2 and 4 of a leading diagonal, always subdivide into zigzags”.
Not disputing that waves 2 and 4 must be zigzags.
But subdivisions 1,3,5 of a leading diagonal MUST
be impulses .
Overlap between 1 and 4 is also allowed
No.
Unless… you know something that Frost and Prechter don’t?
Again, read page 87 of “Elliott Wave Principle”. I’ve already quoted the relevant passage to you.
*edit to add: from page 88: “waves 1, 3 and 5 of a leading diagonal usually subdivide into zigzags but sometimes appear to be impulses”
and
page 88: “wave 4 always ends within the price territory of wave 1” – not sometimes.