
Last analysis expected more downwards movement to start the new trading week which is exactly what happened. The short term target is not yet reached, and the structure is incomplete.
The wave counts remain the same.
Click on the charts below to enlarge.
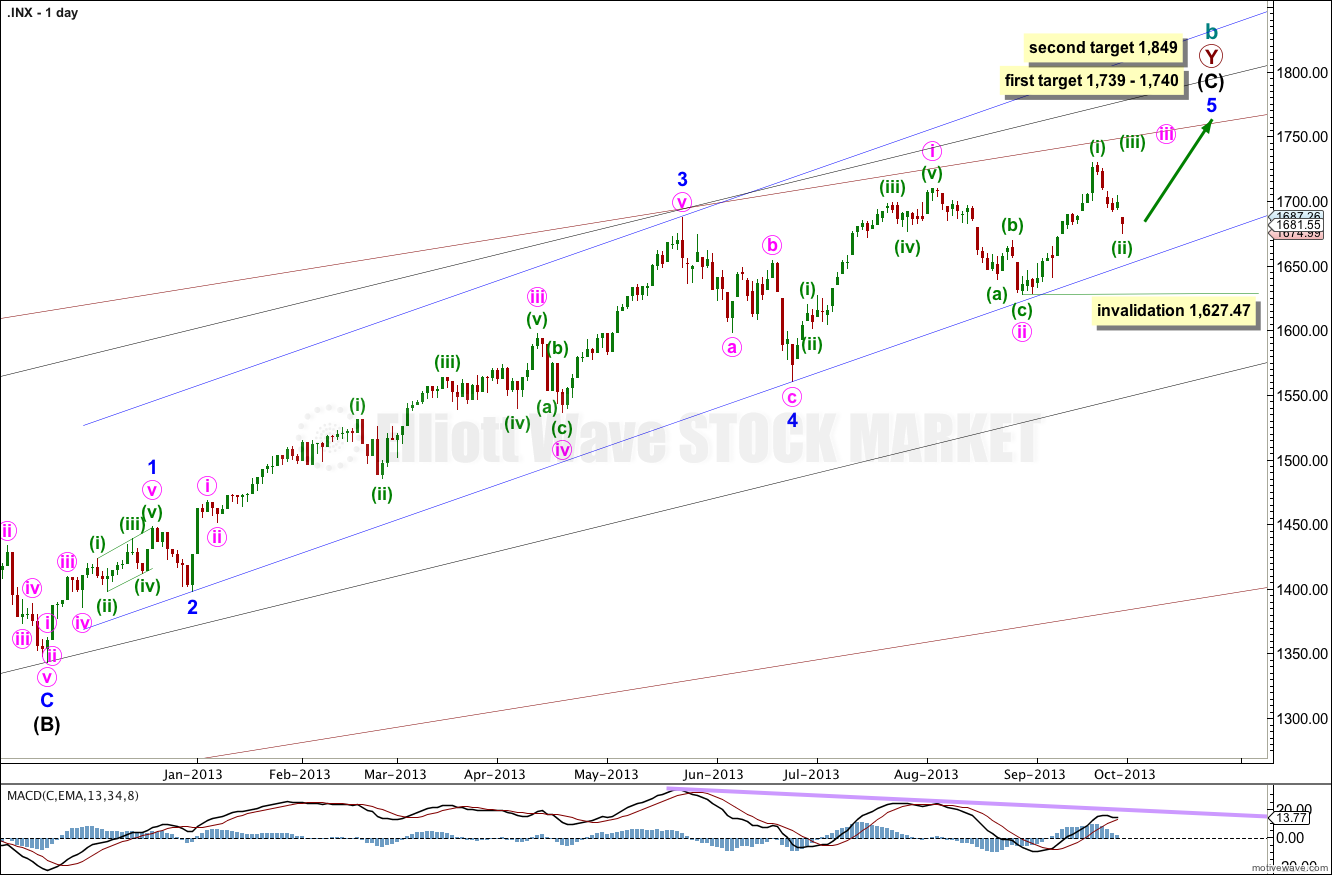
At 1,740 intermediate wave (C) would reach equality with intermediate wave (A). At 1,739 minor wave 5 would reach 0.618 the length of minor wave 3.
If price rises through this first target the next target will be used. At 1,849 minor wave 5 would reach equality with minor wave 3.
When minute waves iii and iv within minor wave 5 are complete I will add to the target calculation at minute wave degree, so at that stage it may change.
Minor wave 1 lasted a Fibonacci 21 days, minor wave 2 lasted a Fibonacci 8 days, minor wave 3 has no Fibonacci duration at 98 days, and minor wave 4 lasted 22 days, just one day longer than a Fibonacci 21.
Minor wave 5 may not exhibit a Fibonacci time relationship. The next possibility may be the 29th of October (give or take two days either side of this date) where minor wave 5 would have lasted a Fibonacci 89 days. This is a date to look out for, but cannot be relied upon because Fibonacci time relationships do not occur often enough to be reliable.
Keep drawing the wider parallel channels from the monthly chart and copy them over to the daily chart.
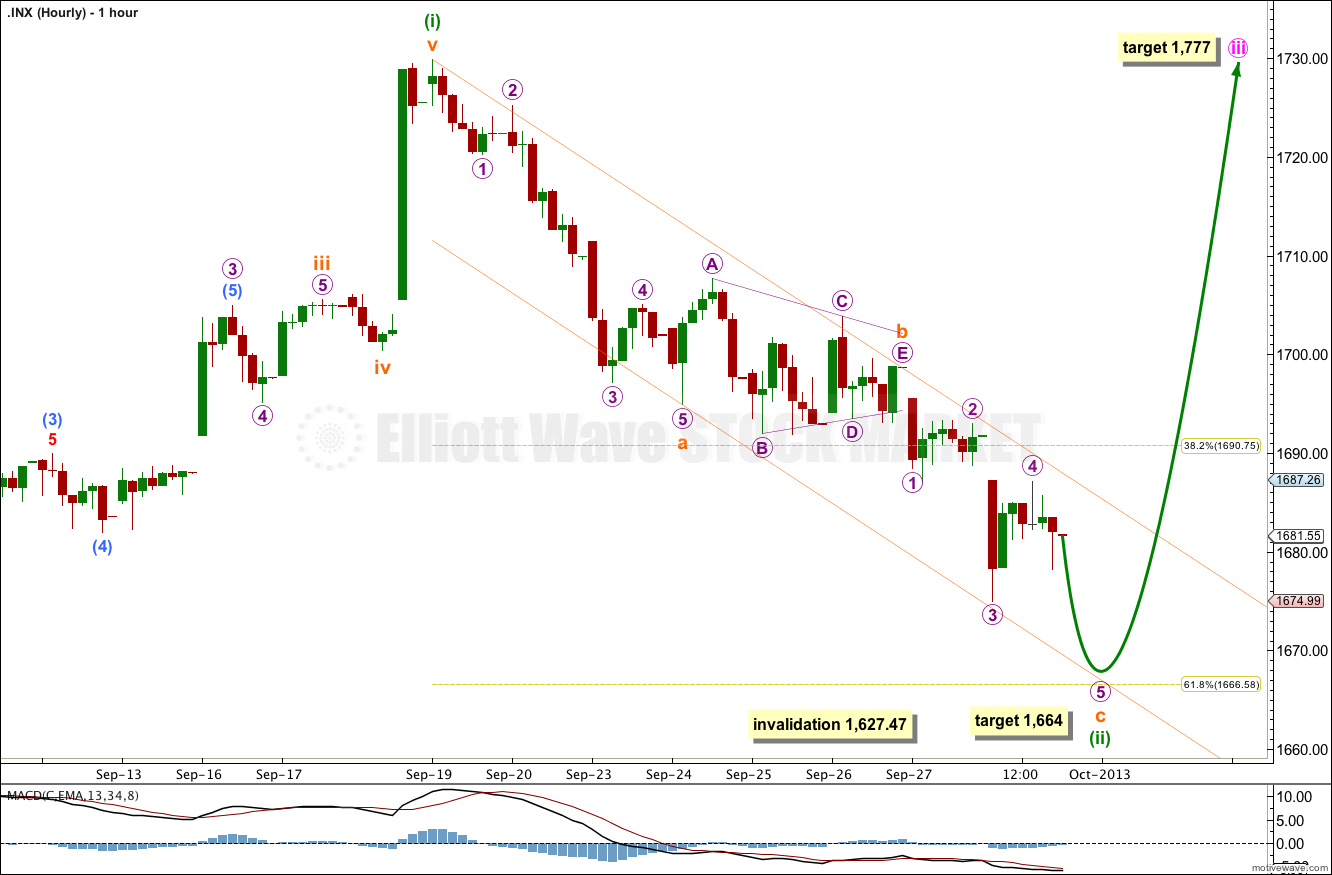
Downwards movement is subdividing into a five wave impulse for subminuette wave c.
Within subminuette wave c micro wave 3 is 1.42 points longer than 1.618 the length of micro wave 1. We may not see a Fibonacci ratio between micro wave 5 and either of 1 or 3.
At 1,664 subminuette wave c would reach equality in length with subminuette wave a.
Draw a parallel channel about minuette wave (ii). While price remains within the channel I will expect more downwards movement. When this channel is clearly breached then the correction should be over and I will expect upwards movement towards the target.
At 1,777 minute wave iii would reach equality in length with minute wave i.
Minuette wave (ii) may not move beyond the start of minuette wave (i). This wave count is invalidated with movement below 1,627.47.
Alternate Daily Wave Count.
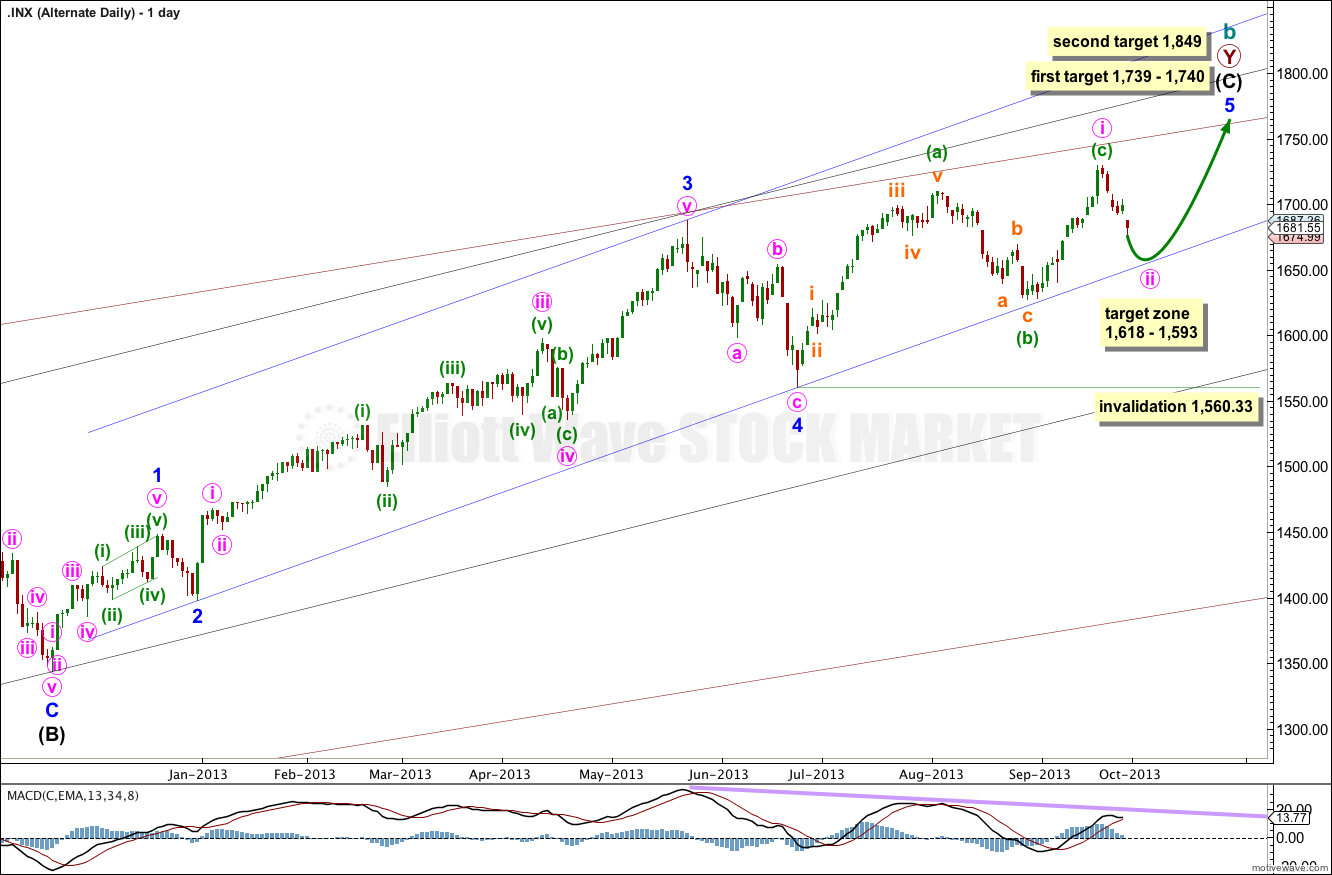
There are two structural possibilities for minor wave 5. The main wave count looks at the most likely structure of an impulse. This alternate will consider the less likely possibility of an ending diagonal.
The ending diagonal may be contracting. All the subwaves must subdivide into zigzags, and the fourth wave must overlap back into first wave price territory.
Minute wave i may be recently completed. Downwards movement may be the start of minute wave ii.
Second waves within diagonals are commonly between 0.66 to 0.81 the length of the first wave. This gives us a target zone between 1,618 and 1,593. I would expect downwards movement to find support at the lower edge of the blue parallel channel (or slightly above this line).
This alternate wave count has a low probability. It would see either a very shallow second wave correction (if price finds support at the blue trend line) or a big overshoot of the long held channel containing intermediate wave (C). Both situations would give the wrong look to this wave count.