
Yesterday’s analysis expected a little downwards movement towards a short term target at 1,687 before a trend change. Price has moved very slowly lower, but the target is not yet reached and the trend change has not yet happened.
Click on the charts below to enlarge.
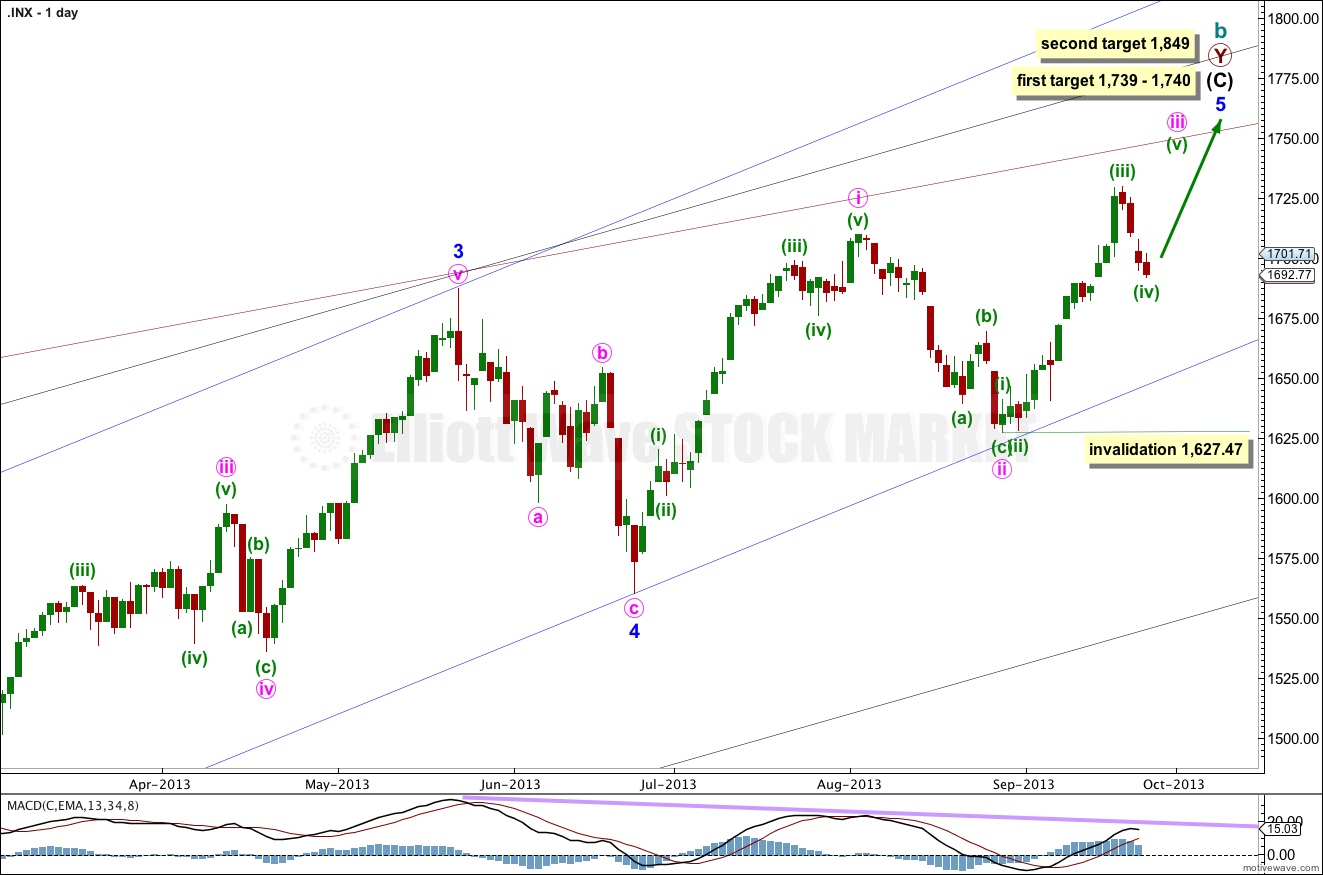
At 1,740 intermediate wave (C) would reach equality with intermediate wave (A). At 1,739 minor wave 5 would reach 0.618 the length of minor wave 3.
If price rises through this first target the next target will be used. At 1,849 minor wave 5 would reach equality with minor wave 3.
When minute waves iii and iv within minor wave 5 are complete I will add to the target calculation at minute wave degree, so at that stage it may change.
Minor wave 1 lasted a Fibonacci 21 days, minor wave 2 lasted a Fibonacci 8 days, minor wave 3 has no Fibonacci duration at 98 days, and minor wave 4 lasted 22 days, just one day longer than a Fibonacci 21.
Minor wave 5 may not exhibit a Fibonacci time relationship. The next possibility may be the 29th of October (give or take two days either side of this date) where minor wave 5 would have lasted a Fibonacci 89 days. This is a date to look out for, but cannot be relied upon because Fibonacci time relationships do not occur often enough to be reliable.
Keep drawing the wider parallel channels from the monthly chart and copy them over to the daily chart.
*the candlestick for the 23rd of September is still AWOL. I’m sending out a search party for it.
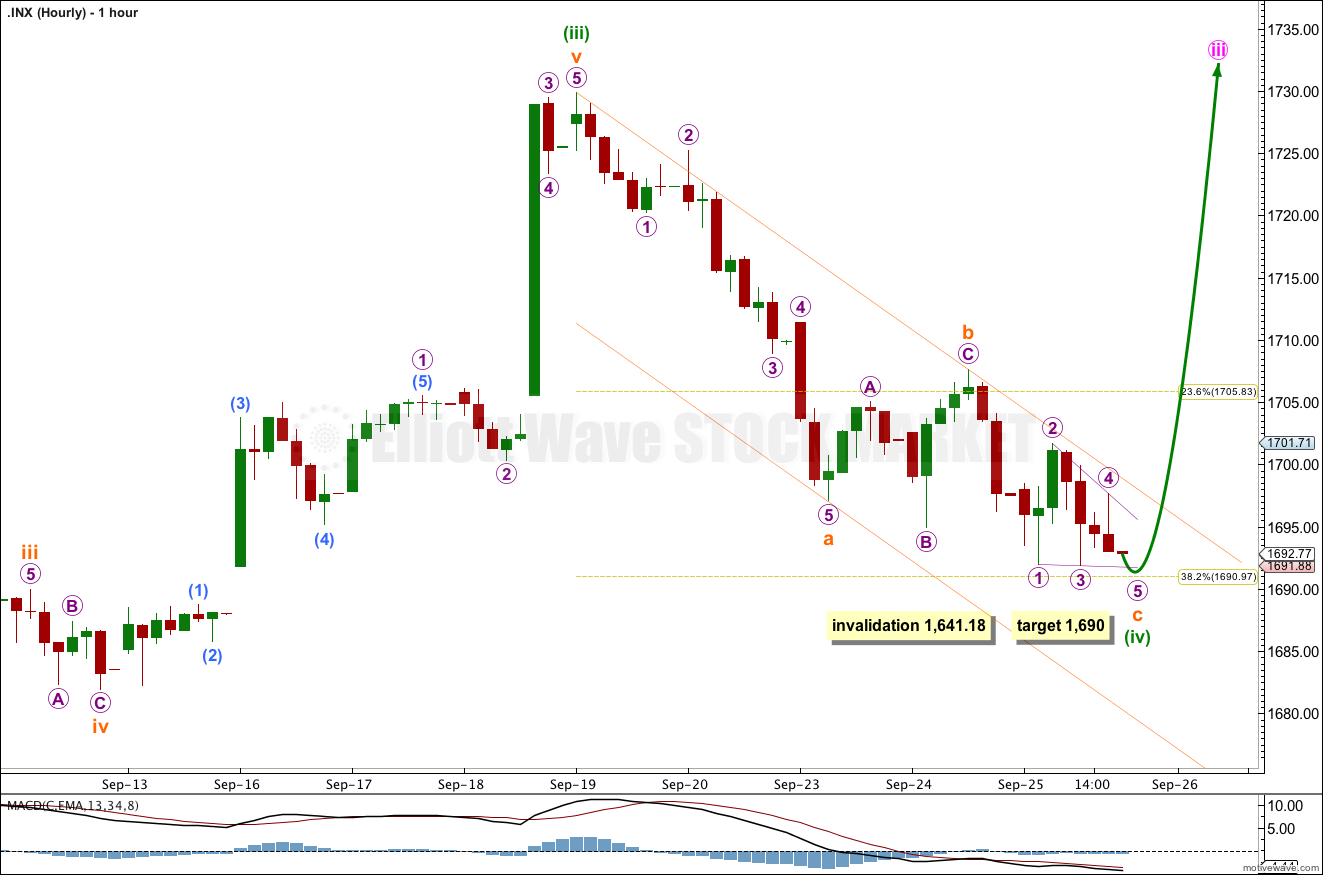
Downwards movement for last session is choppy and overlapping. On the five minute chart this subdivides into a series of zigzags very easily. We may be seeing a small contracting ending diagonal complete for subminuette wave c.
The diagonal is contracting and the third wave is shorter than the first. This limits the fifth wave to no longer than equality with the third which would be at 1,687.85.
For contracting diagonals the fifth wave normally ends at the 1-3 trend line. I would expect price to find support here.
Minuette wave (iv) may end at the 0.382 Fibonacci ratio of minuette wave (i) at 1,690.
Daily Alternate Wave Count.
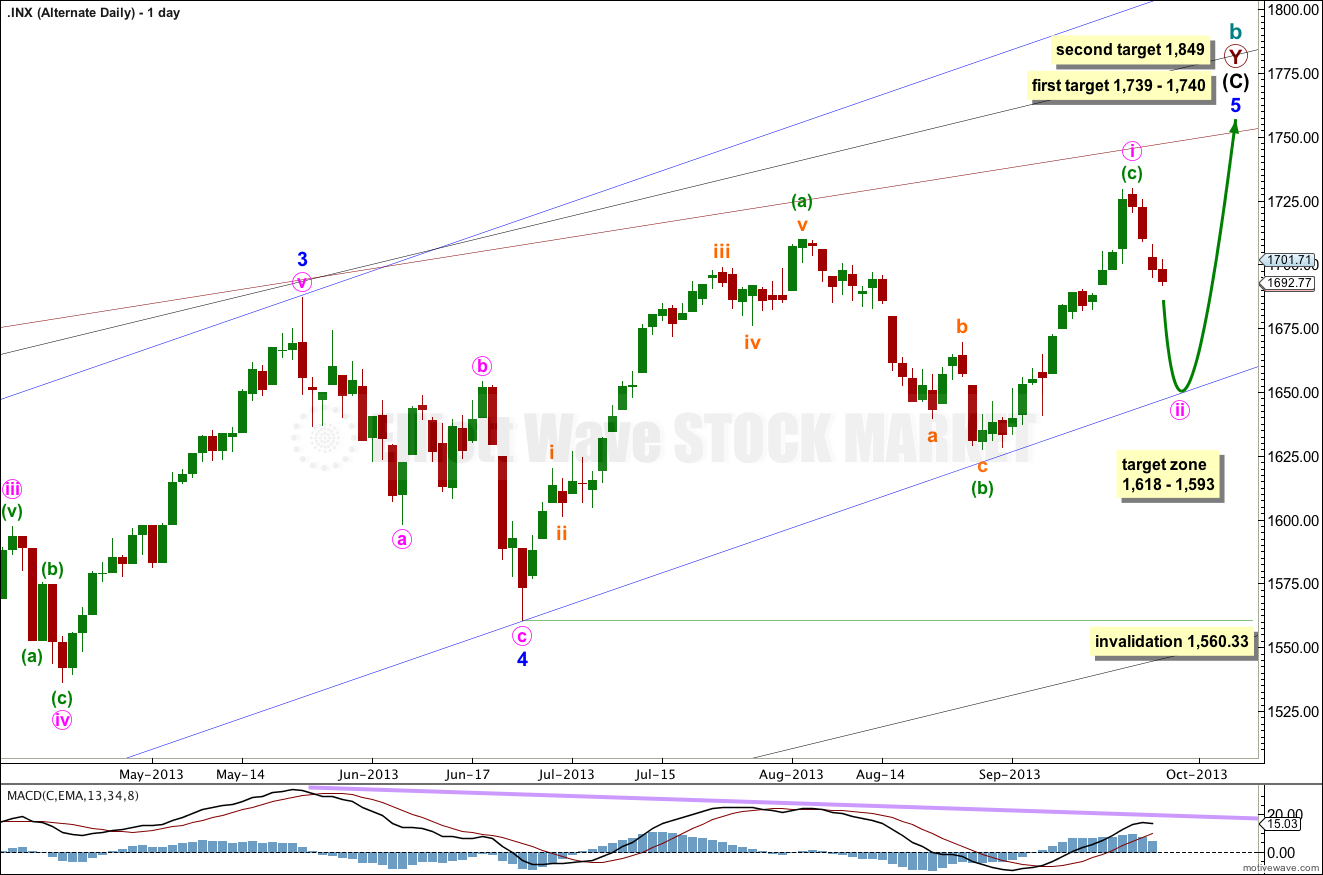
There are two structural possibilities for minor wave 5. The main wave count looks at the most likely structure of an impulse. This alternate will consider the less likely possibility of an ending diagonal.
The ending diagonal may be contracting. All the subwaves must subdivide into zigzags, and the fourth wave must overlap back into first wave price territory.
Minute wave i may be recently completed. Downwards movement may be the start of minute wave ii.
Second waves within diagonals are commonly between 0.66 to 0.81 the length of the first wave. This gives us a target zone between 1,618 and 1,593. I would expect downwards movement to find support at the lower edge of the blue parallel channel (or slightly above this line).
Minute wave ii may not move beyond the start of minute wave i. This wave count is invalidated with movement below 1,560.33.