
The invalidation point on the hourly chart was breached. This has necessitated a thorough reanalysis of the wave count, including the monthly chart. This changes the situation significantly.
I expect now that the FTSE is in a final fifth wave upwards towards an all time high.
Click on the charts below to enlarge.
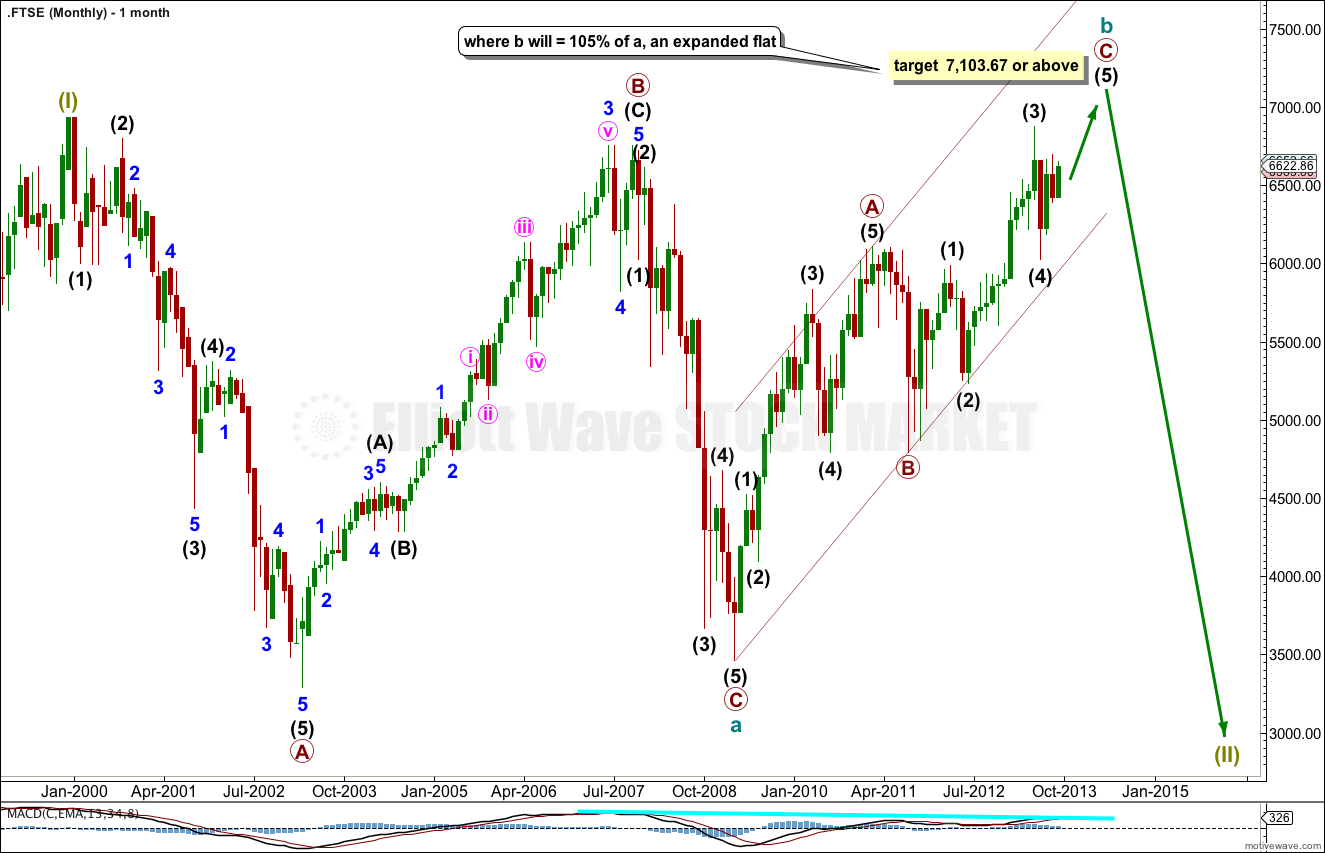
This structure unfolding is a large supercycle flat correction. The most common type of flat is an expanded flat which requires cycle wave b to reach a minimum of 90% the length of cycle wave a. This would be achieved at 7,103.67. It is very likely price will get at least to this point, or above.
Within cycle wave b primary wave C is now in the final fifth wave.
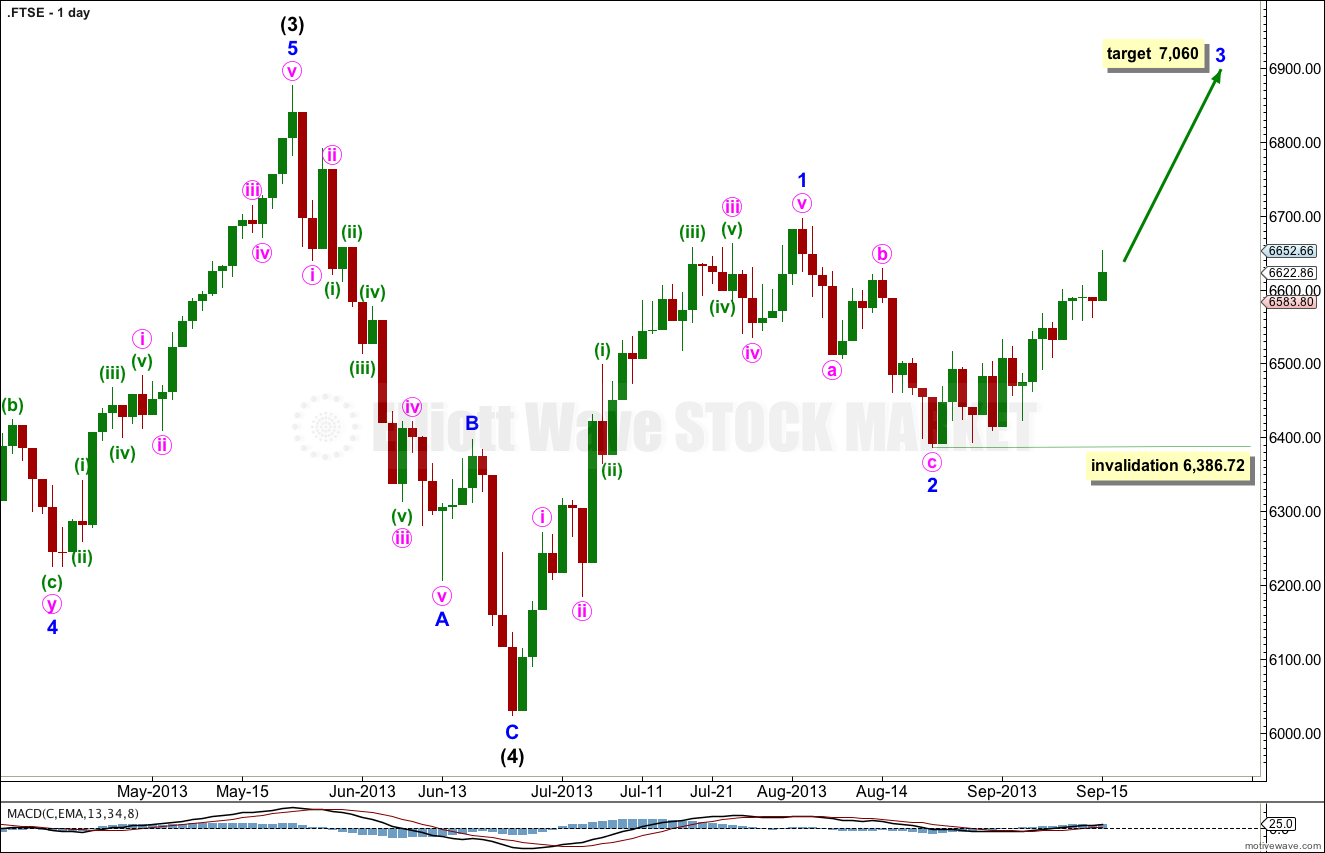
Within intermediate wave (4) it is possible to see this structure as a completed zigzag.
The following upwards movement for minor wave 1 of intermediate wave (5) is ambiguous. It can be seen as either a three or a five. This wave count sees it as a five.
Downwards movement for minor wave 2 subdivides as a zigzag. The subdivisons of that are shown in the next chart below.
Within minor wave 3 no second wave correction may move beyond the start of the first wave. This wave count is invalidated with movement below 6,386.72.
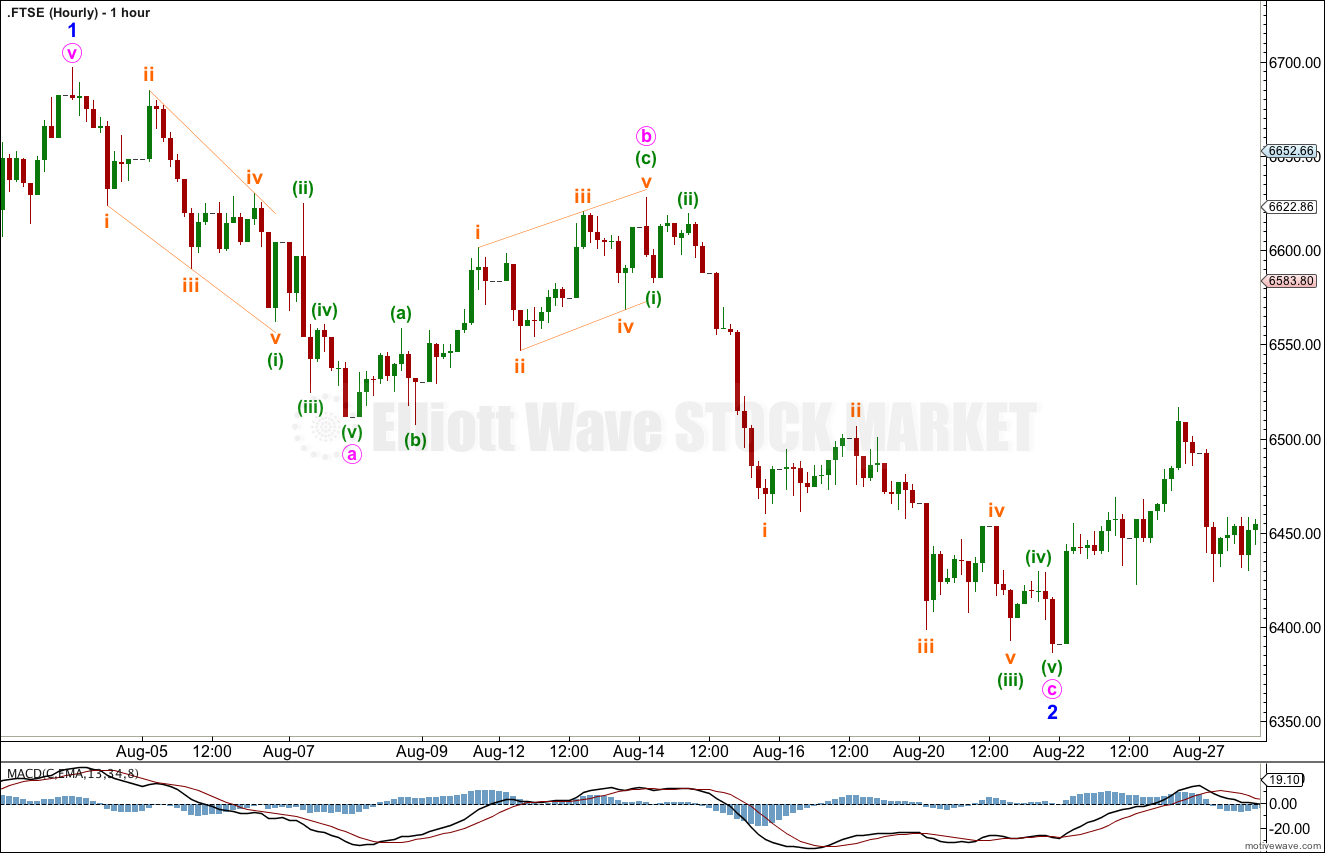
This chart shows the subdivisions of the second wave zigzag.
There is no Fibonacci ratio between minute waves a and c.
Minute wave b is an expanded flat correction. Within it subminuette wave c is 3.32 points short of 2.618 the length of subminuette wave a.
Ratios within minute wave a are: minuette wave (iii) has no Fibonacci ratio to minuette wave (i), and minuette wave (v) is 2.14 points short of 0.382 the length of minuette wave (i).
Ratios within minute wave c are: there is no Fibonacci ratio between minuette waves (i) and (iii), and minuette wave (v) is just 2.69 short of equality with minuette wave (i).
Ratios within minuette wave (iii) are: subminuette wave iii is 9.57 points longer than 0.618 the length of subminuette wave i, and subminuette wave v is 0.1 points longer than 0.382 the length of subminuette wave i.
The previous problem I had with this movement was trying to see the first downwards wave as ending at the low labeled minuette wave (b) within minute wave b. It is much clearer to see a big zigzag trending downwards when this is seen as part of the following movement.
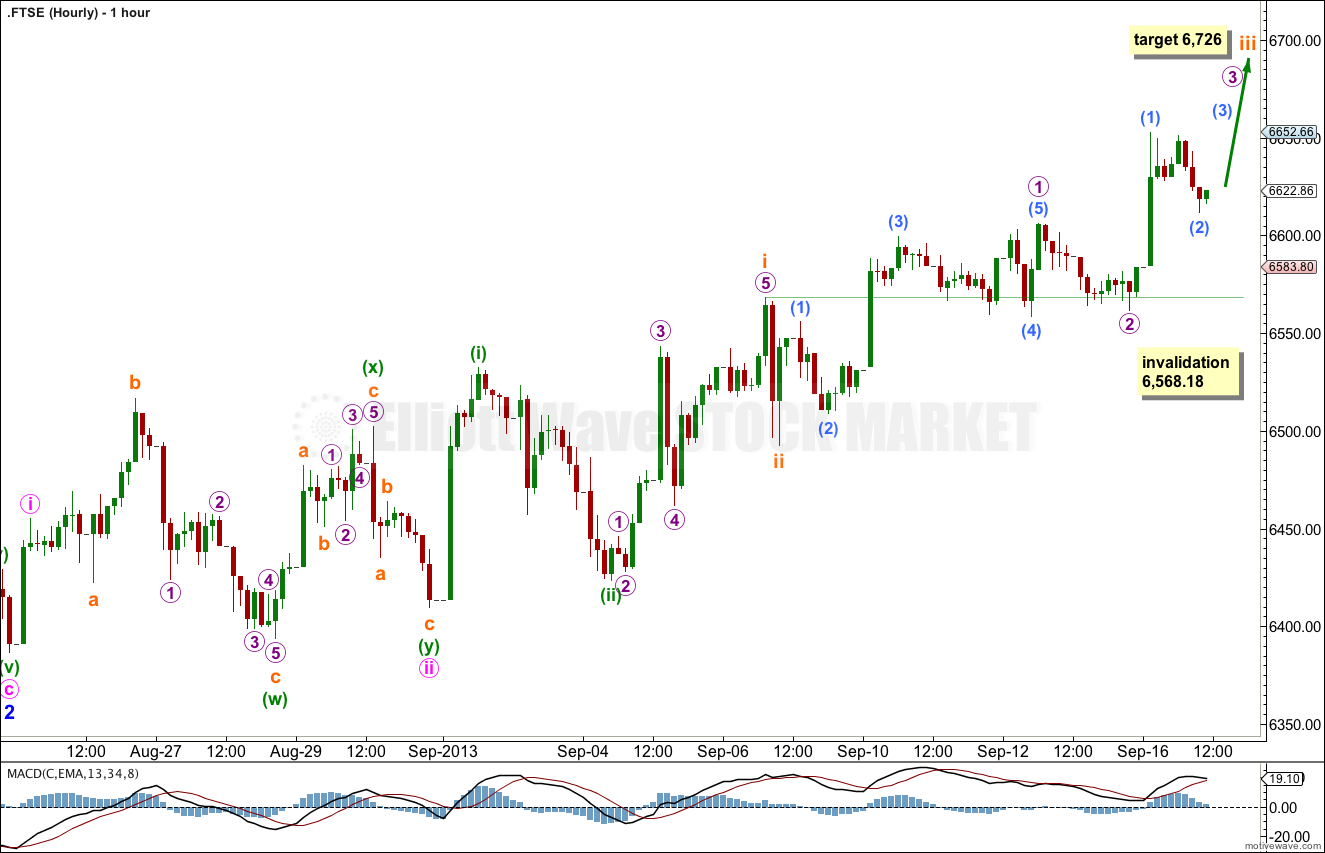
So far upwards movement is very choppy and overlapping. There is some increase in momentum, and a third wave may be starting to show itself.
This wave count sees a series of five overlapping first and second waves so far.
At 6,726 subminuette wave iii would reach 1.618 the length of subminuette wave i.
If labeling of micro waves 1 and 3 are correct then we should see a strong increase in upwards momentum over the next day or so. However, there is more than one way to label these waves, particularly in the last 24 hours movement.
Either way, this third wave is incomplete.
When subminuette wave iii is complete subminuette wave iv should move price lower. Subminuette wave iv may not move into subminuette wave i price territory. This wave count is invalidated with movement below 6,568.18.