
Last analysis expected more downwards movement to begin the new trading week, before a third wave up. This is not what happened, the second wave correction was already over and the third wave up had begun.
Click on the charts below to enlarge.
Main Wave Count.
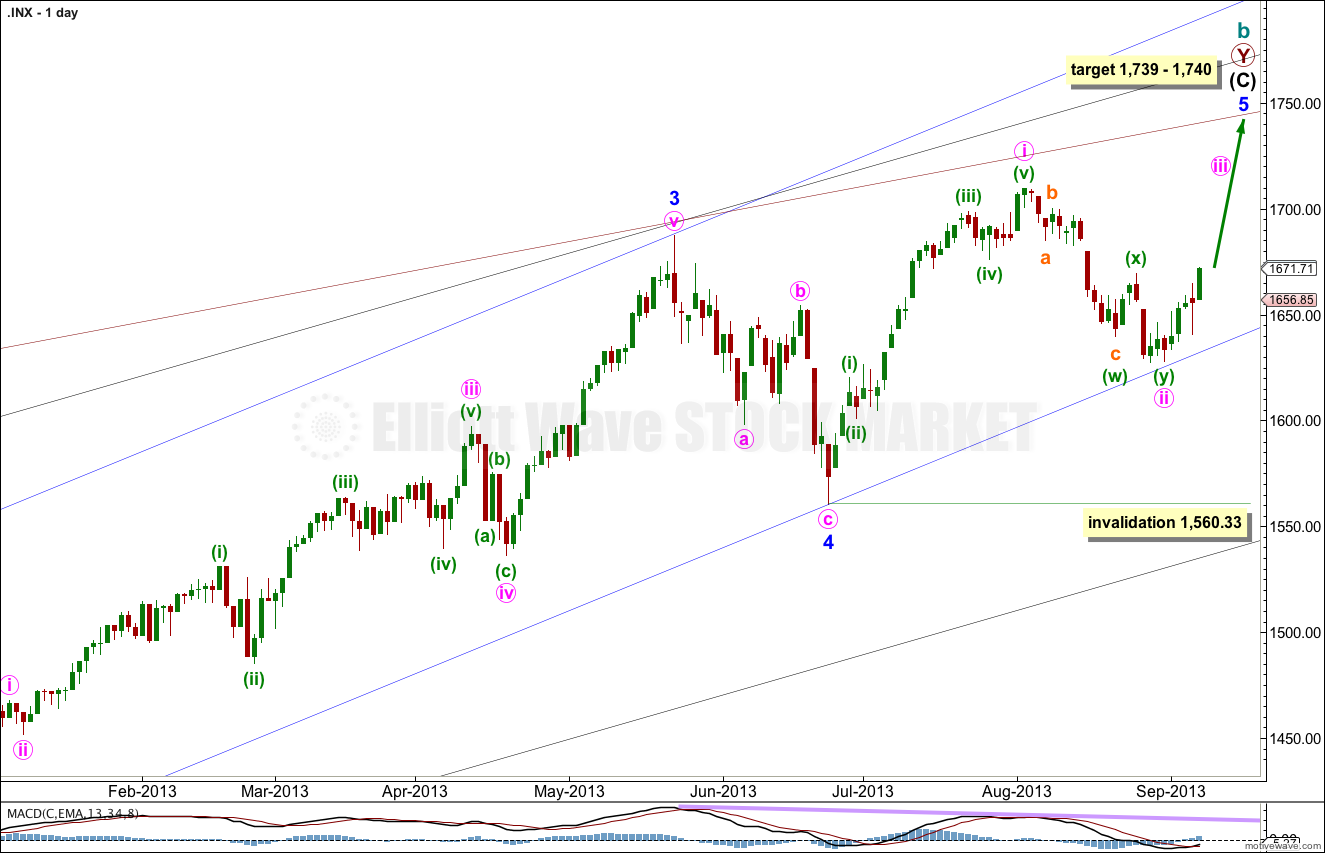
This wave count agrees with MACD and has some nice Fibonacci ratios in price and Fibonacci relationships in time.
Minor wave 3 is 15.1 points longer than 2.618 the length of minor wave 1.
Ratios within minor wave 3 are: there is no Fibonacci ratio between minute waves iii and i, and minute wave v is 5.44 points longer than equality with minute wave iii.
At 1,740 intermediate wave (C) would reach equality with intermediate wave (A). At 1,739 minor wave 5 would reach 0.618 the length of minor wave 3.
Within minor wave 5 minute wave ii may not move beyond the start of minute wave i. This wave count is invalidated with movement below 1,560.33.
Minor wave 1 lasted a Fibonacci 21 days, minor wave 2 lasted a Fibonacci 8 days, minor wave 3 has no Fibonacci duration at 98 days, and minor wave 4 lasted 22 days, just one day longer than a Fibonacci 21.
Minor wave 5 may not exhibit a Fibonacci time relationship. The next possibility may be the 29th of October (give or take two days either side of this date) where minor wave 5 would have lasted a Fibonacci 89 days.
Keep drawing the wider parallel channels from the monthly chart and copy them over to the daily chart.
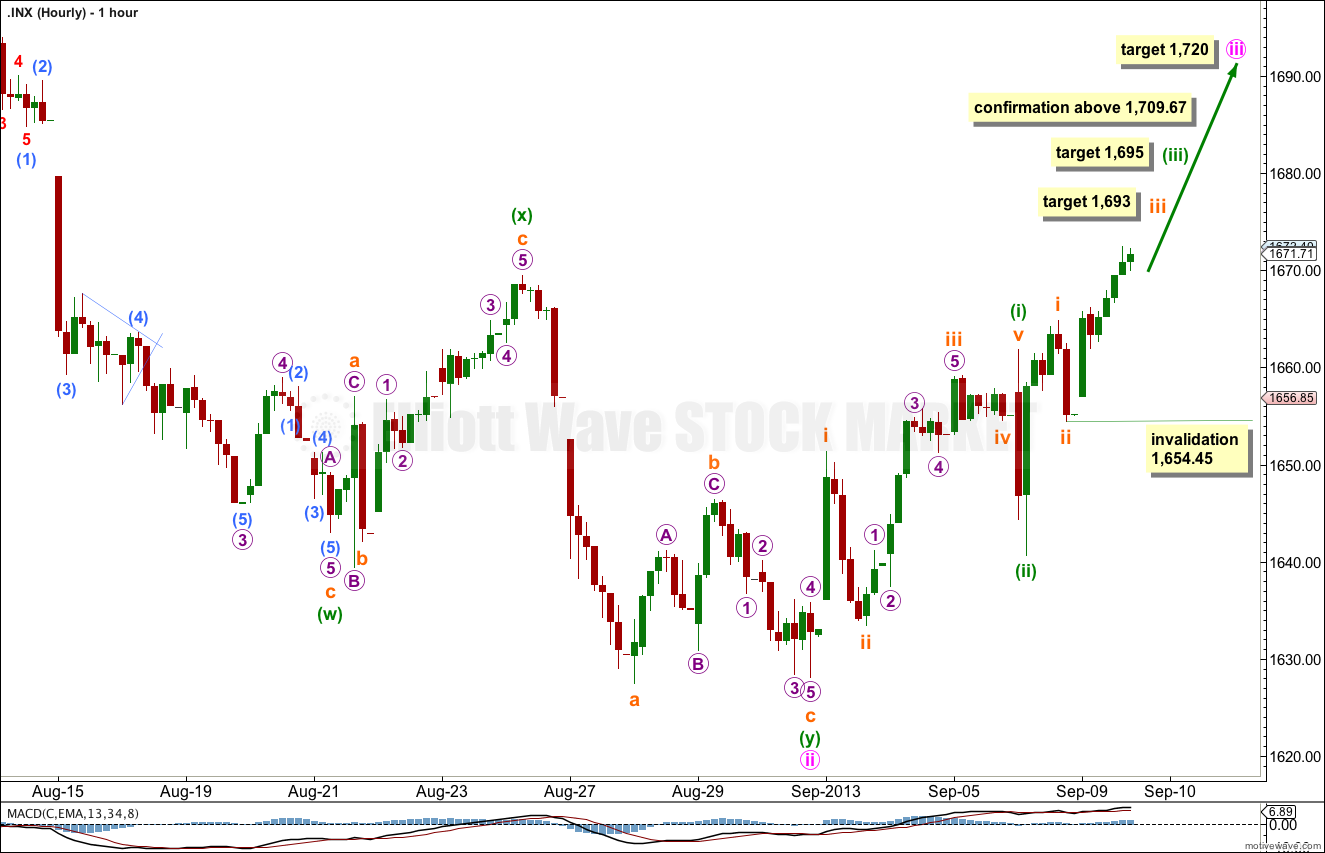
Minuette wave (ii) was already over as a very brief zigzag. Minuette wave (iii) has begun and would reach 1.618 the length of minuette wave (i) at 1,695.
Within minuette wave (iii) subminuette waves i and ii are completed. Subminuette wave iii has begun. At 1,693 subminuette wave iii would reach 1.618 the length of subminuette wave i.
Within subminuette wave iii no second wave correction may move beyond the start of the first wave. This wave count is invalidated with movement below 1,654.45.
Alternate Wave Count.
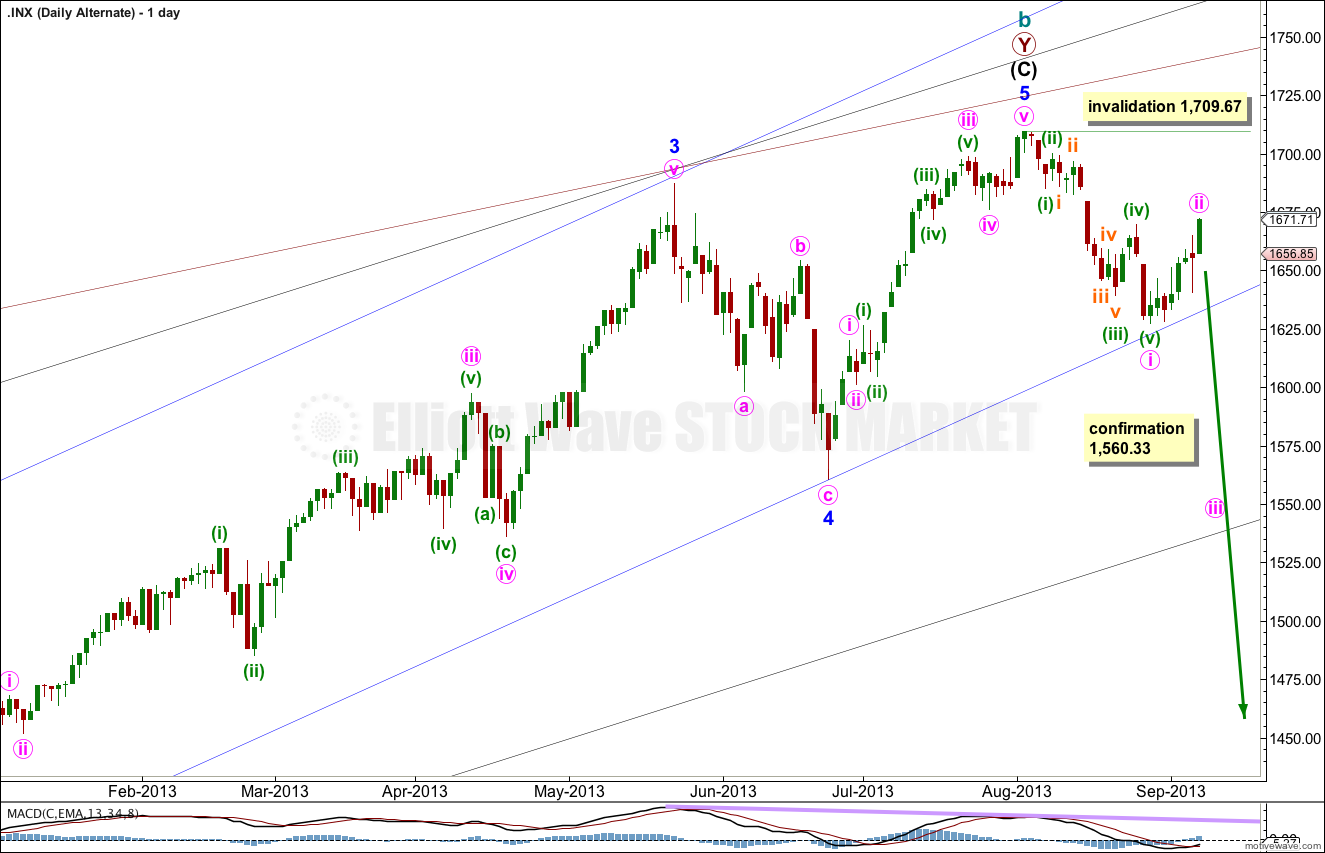
While price remains below 1,709.67 it will remain possible that we have recently seen a trend change at cycle degree. However, we should always assume the trend remains the same until proven otherwise.
This is a huge trend change. The new downwards trend should last from one to several years and take price substantially below 666.76. We need some confirmation before having confidence in this wave count.
We should assume the trend is upwards until this wave count is confirmed with movement below 1,560.33, and then with a breach of the black parallel channel on the daily chart.
This wave count is the same as the main wave count, except the degree of labeling in the final upwards wave of minor wave 5 is moved up one degree.
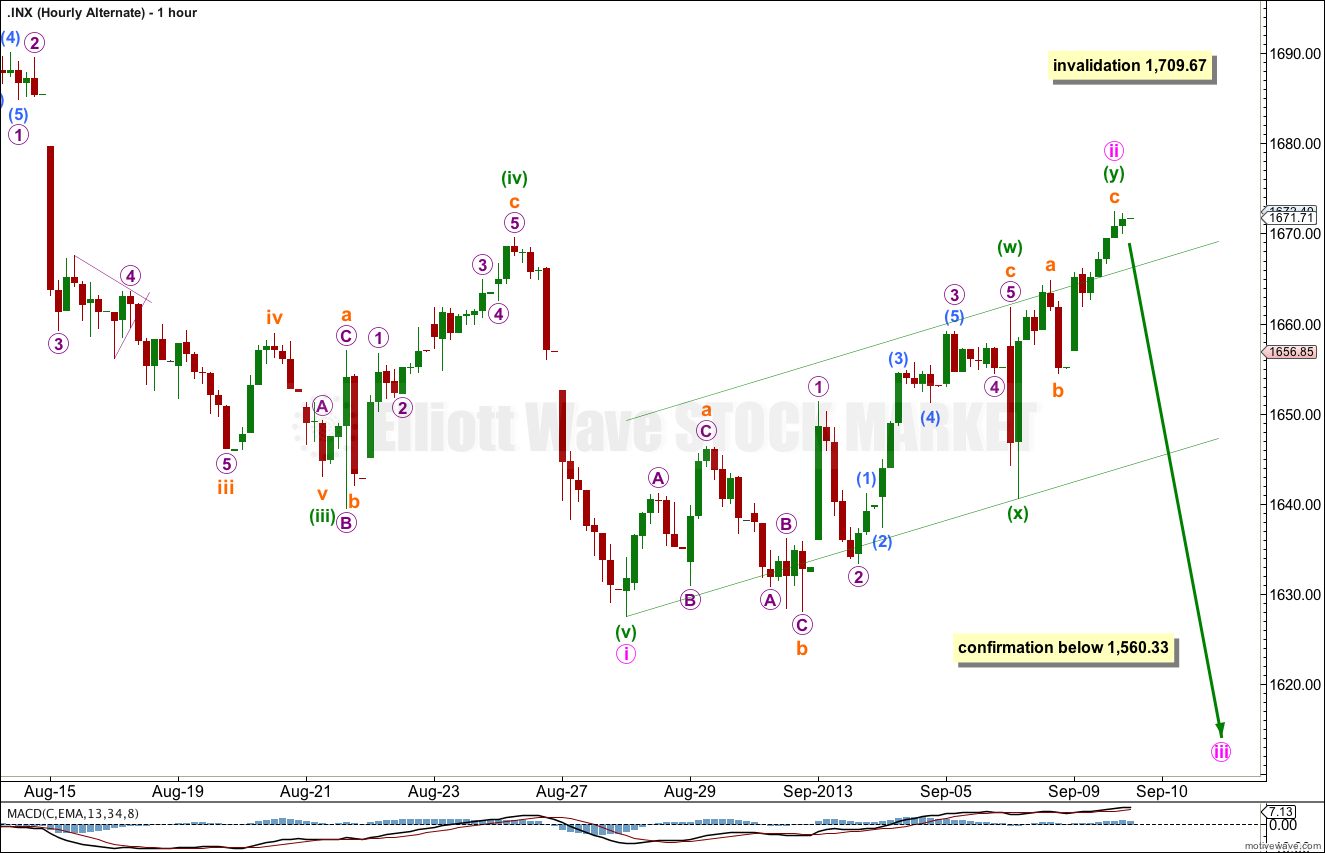
Minute wave ii may not be a completed double combination: flat – X – zigzag. However, the purpose of double combinations is to take up time and move price sideways. This structure is clearly trending upwards, not sideways, which reduces the probability of this wave count.
Within minuette wave (y) there is no Fibonacci ratio between subminuette waves a and c.
I have drawn a best fit channel about this upwards movement. We would need to see this breached by downwards movement to have confirmation that minute wave ii is complete. Until a channel breach is seen we must accept the possibility that minute wave ii could continue higher. Minute wave ii may not move beyond the start of minute wave i. This wave count is invalidated with movement above 1,709.67.
I have tried to see if minute wave ii could subdivide as a single zigzag which would make more sense. I can make such a wave count fit, but it looks too forced. It has all the wrong look. But the chart above also looks wrong, in that a combination should move sideways not trend sharply. At this stage this alternate wave count does not have the right look, and its probability must be reduced.