
Downwards movement for Friday was expected for the main wave count. The target has not yet been reached.
The wave counts remain the same.
Click on the charts below to enlarge.
Main Wave Count.
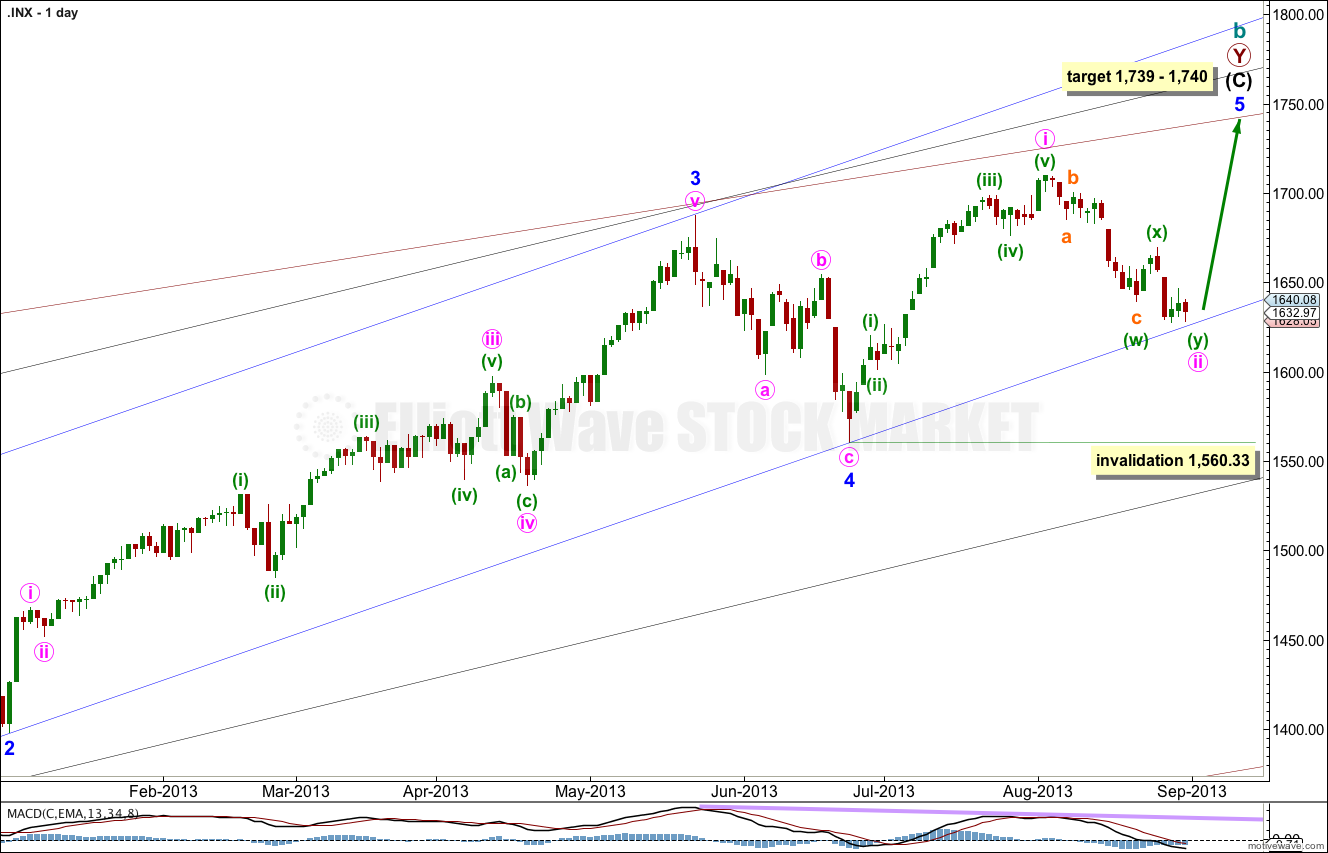
This wave count agrees with MACD and has some nice Fibonacci ratios in price and Fibonacci relationships in time.
Minor wave 3 is 15.1 points longer than 2.618 the length of minor wave 1.
Ratios within minor wave 3 are: there is no Fibonacci ratio between minute waves iii and i, and minute wave v is 5.44 points longer than equality with minute wave iii.
At 1,740 intermediate wave (C) would reach equality with intermediate wave (A). At 1,739 minor wave 5 would reach 0.618 the length of minor wave 3.
Within minor wave 5 minute wave ii may not move beyond the start of minute wave i. This wave count is invalidated with movement below 1,560.33.
Minor wave 1 lasted a Fibonacci 21 days, minor wave 2 lasted a Fibonacci 8 days, minor wave 3 has no Fibonacci duration at 98 days, and minor wave 4 lasted 22 days, just one day longer than a Fibonacci 21.
Minor wave 5 may not exhibit a Fibonacci time relationship. However, the next Fibonacci number in the sequence is 55 which could see minor wave 5 ending on 10th September (give or take a day or two either side). This may be the next possibility. At that time I will see if the structure could be considered complete, or not.
Keep drawing the wider parallel channels from the monthly chart and copy them over to the daily chart.
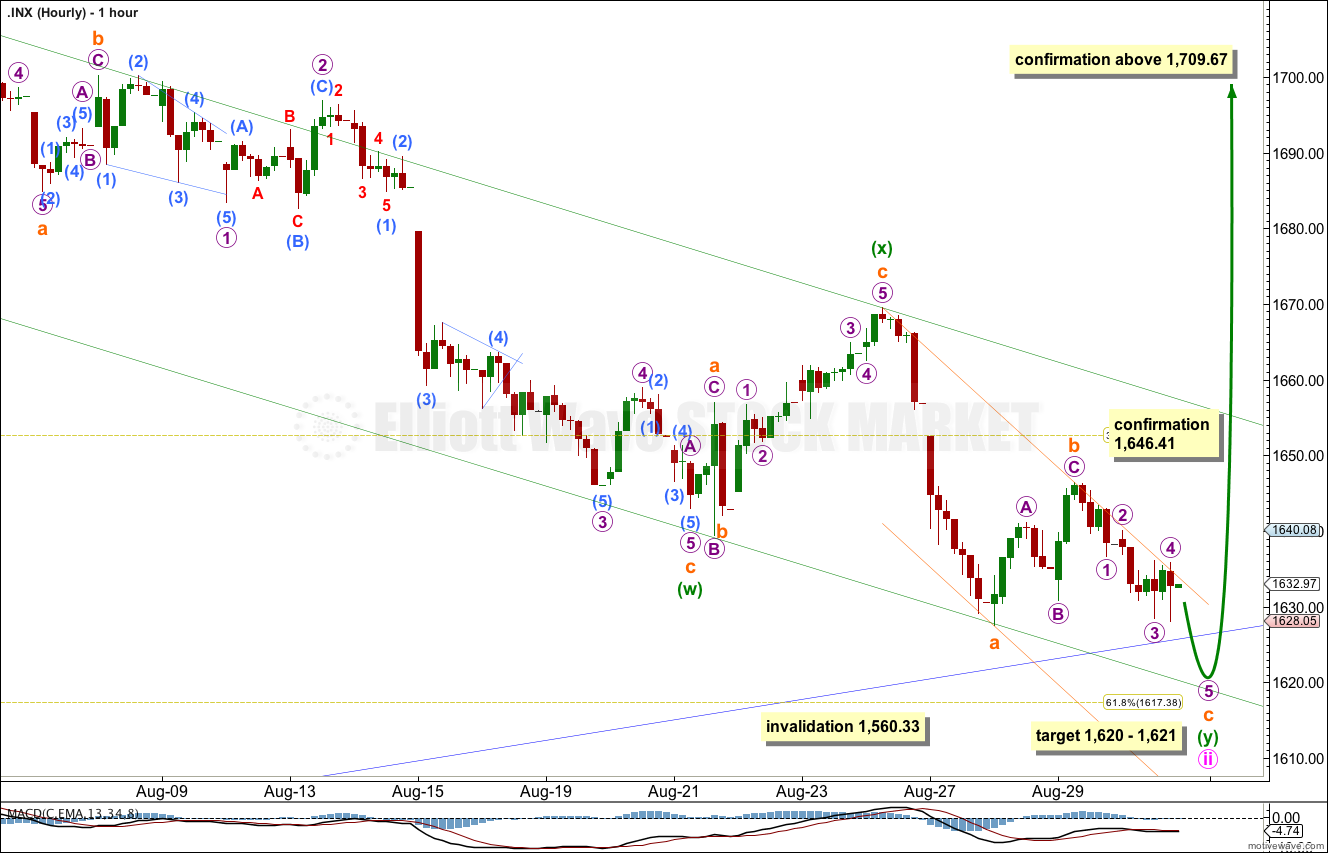
Downwards movement so far has unfolded as three waves. The final fifth wave may possibly be complete or it may move lower on Monday. If this structure takes one more day to complete it would have lasted a Fibonacci 21 days and a truncation would be avoided.
At 1,620 subminuette wave c would reach 0.618 the length of subminuette wave a. At 1,621 micro wave 5 would reach equality in length with micro wave 3.
Price movement above 1,646.41 would confirm that minute wave ii is over and minute wave iii should then be underway.
Initially price movement above 1,635.80 would be an indication that micro wave 5 is over, and at that stage it would be likely subminuette wave c is over also. That would be the earliest indication of a mid term trend change.
Minute wave ii may not move beyond the start of minute wave i. This wave count is invalidated with movement below 1,560.33.
Alternate Wave Count.
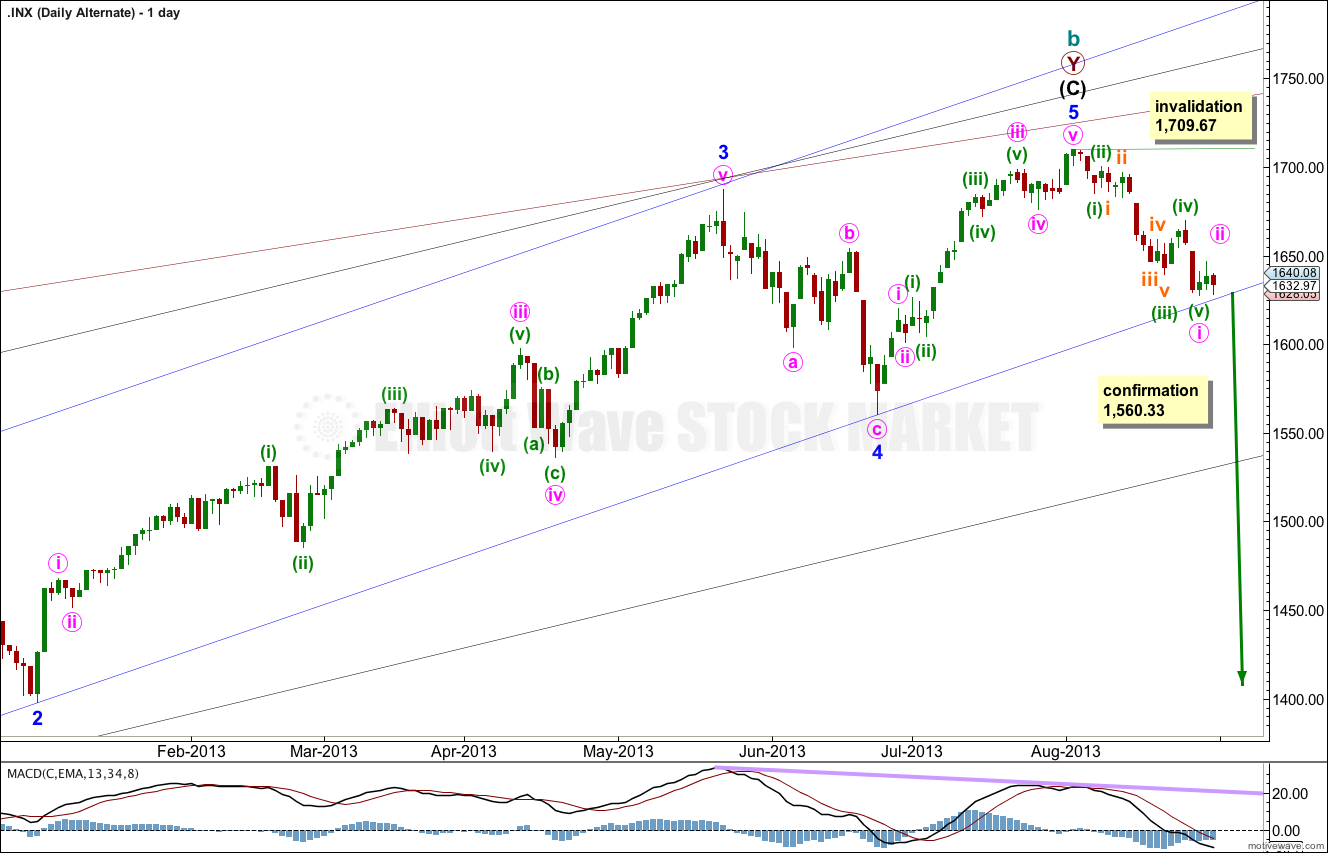
While price remains below 1,709.67 it will remain possible that we have recently seen a trend change at cycle degree. However, we should always assume the trend remains the same until proven otherwise.
This is a huge trend change. The new downwards trend should last from one to several years and take price substantially below 666.76. We need some confirmation before having confidence in this wave count.
We should assume the trend is upwards until this wave count is confirmed with movement below 1,560.33, and then with a breach of the black parallel channel on the daily chart.
This wave count is the same as the main wave count, except the degree of labeling in the final upwards wave of minor wave 5 is moved up one degree.
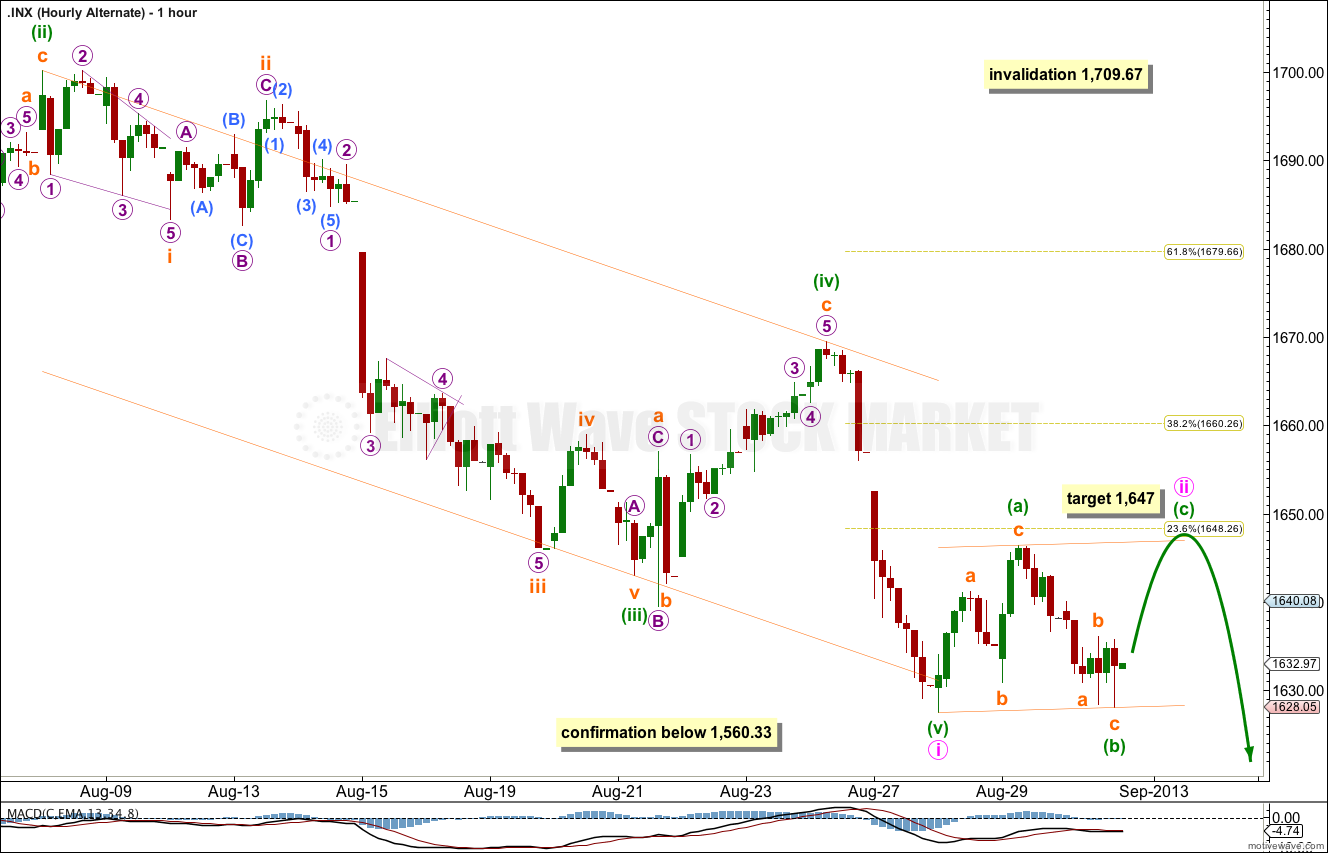
For this alternate we may be near the end of minute wave ii. So far this structure subdivides as a regular flat correction. Regular flats most commonly have C waves which are close to equality with A waves. At 1,647 minuette wave (c) would reach equality with minuette wave (a). This would bring price up to touch the upper trend channel containing the flat, and minute wave ii would be about the 0.236 Fibonacci ratio of minute wave i.
When minute wave ii is completed this alternate expects an increase in downwards momentum as a third wave begins. This should take price below 1,560.33 and would provide confirmation of this wave count.
Minute wave ii may not move beyond the start of minute wave i. This wave count is invalidated with movement above 1,709.67.