
Last analysis expected upwards movement for Monday’s session to reach a short term target at 1,669. Price began by moving higher on Monday and turned at 1,669.51.
Click on the charts below to enlarge.
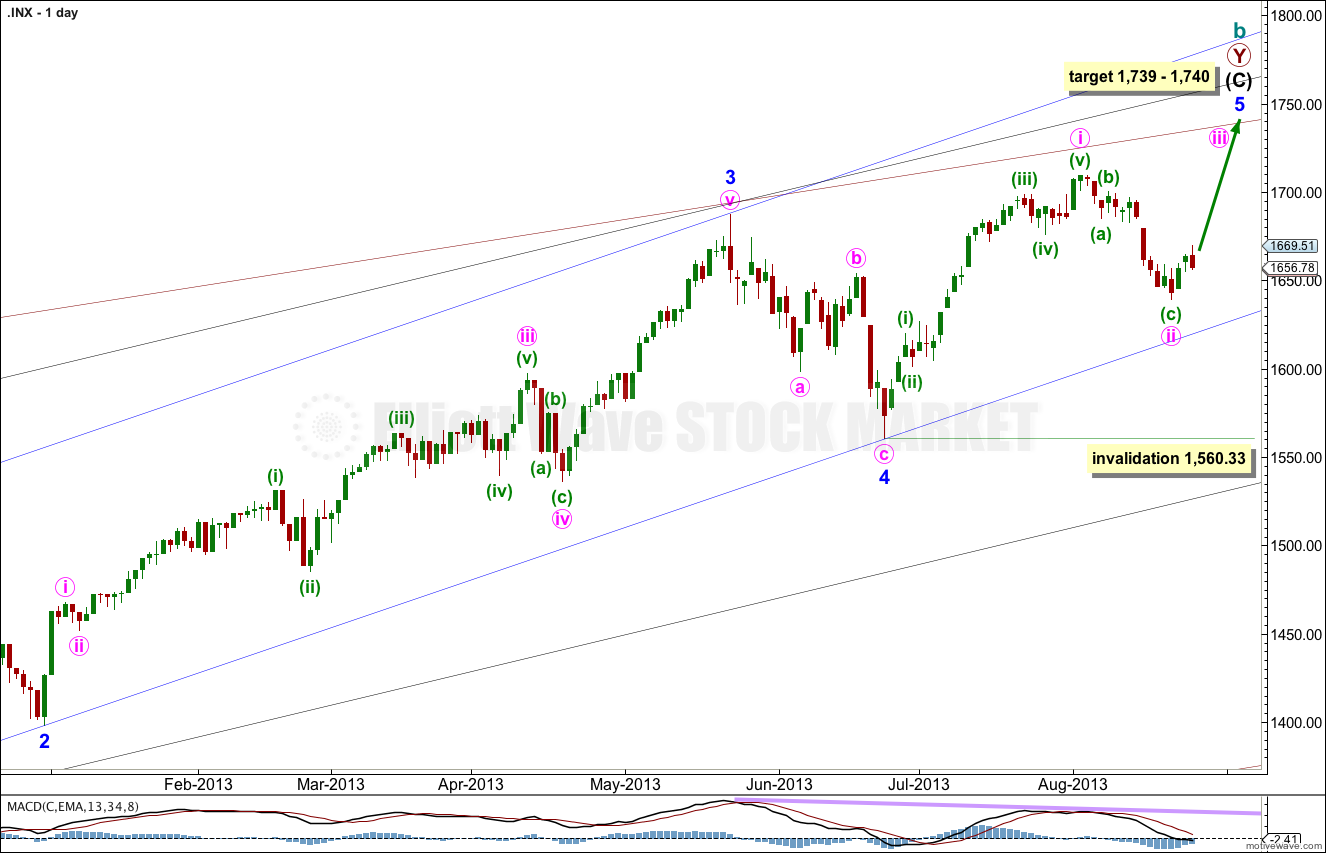
This wave count agrees with MACD and has some nice Fibonacci ratios in price and Fibonacci relationships in time.
Minor wave 3 is 15.1 points longer than 2.618 the length of minor wave 1.
Ratios within minor wave 3 are: there is no Fibonacci ratio between minute waves iii and i, and minute wave v is 5.44 points longer than equality with minute wave iii.
At 1,740 intermediate wave (C) would reach equality with intermediate wave (A). At 1,739 minor wave 5 would reach 0.618 the length of minor wave 3.
Within minor wave 5 minute wave ii may not move beyond the start of minute wave i. This wave count is invalidated with movement below 1,560.33.
Minor wave 1 lasted a Fibonacci 21 days, minor wave 2 lasted a Fibonacci 8 days, minor wave 3 has no Fibonacci duration at 98 days, and minor wave 4 lasted 22 days, just one day longer than a Fibonacci 21.
Minor wave 5 may not exhibit a Fibonacci time relationship. However, the next Fibonacci number in the sequence is 55 which could see minor wave 5 ending on 10th September (give or take a day or two either side). This may be the next possibility. At that time I will see if the structure could be considered complete, or not.
Keep drawing the wider parallel channels from the monthly chart and copy them over to the daily chart.
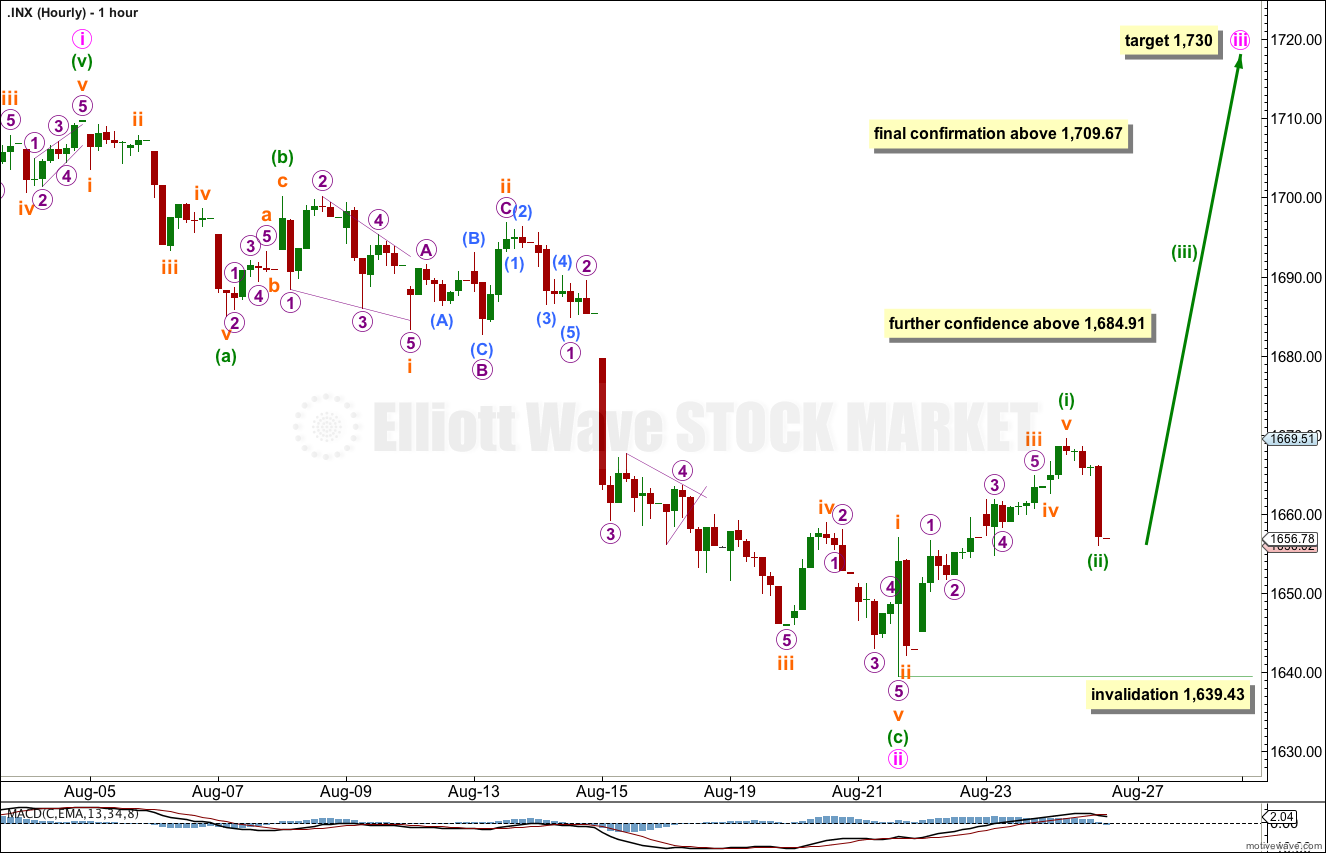
Upwards movement was expected to end subminuette wave iii at 1,669 and was expected to be followed by a shallow correction for subminuette wave iv. Price has moved back into subminuette wave i territory so this downwards movement cannot be subminuette wave iv. It is likely to be the deeper second wave correction I thought was another day away for minuette wave (ii).
Within minuette wave (i) subminuette wave iii has no Fibonacci ratio to subminuette wave i, and subminuette wave v is 0.48 points short of 0.382 the length of subminuette wave i.
On the five minute chart there is so much overlapping within subminuette waves iii and v, it is not possible to determine if this upwards movement is a five or a three wave structure. With the labeling here there is nice alternation between subminuette wave ii as a deep zigzag and subminuette wave iv as a flat or combination, and they are nicely in proportion.
It would be most likely that we shall see a little more downwards movement tomorrow as minuette wave (ii) completes. When that is done we should see an increase in upwards momentum for minuette wave (iii).
Minuette wave (ii) may not move beyond the start of minuette wave (i). This wave count is invalidated with movement below 1,639.43.
Alternate Wave Count.
While price remains below 1,709.67 it will remain possible that we have recently seen a trend change at cycle degree. However, we should always assume the trend remains the same until proven otherwise.
We should assume the trend is upwards until this wave count is confirmed with movement below 1,560.33, and then with a breach of the black parallel channel on the daily chart.
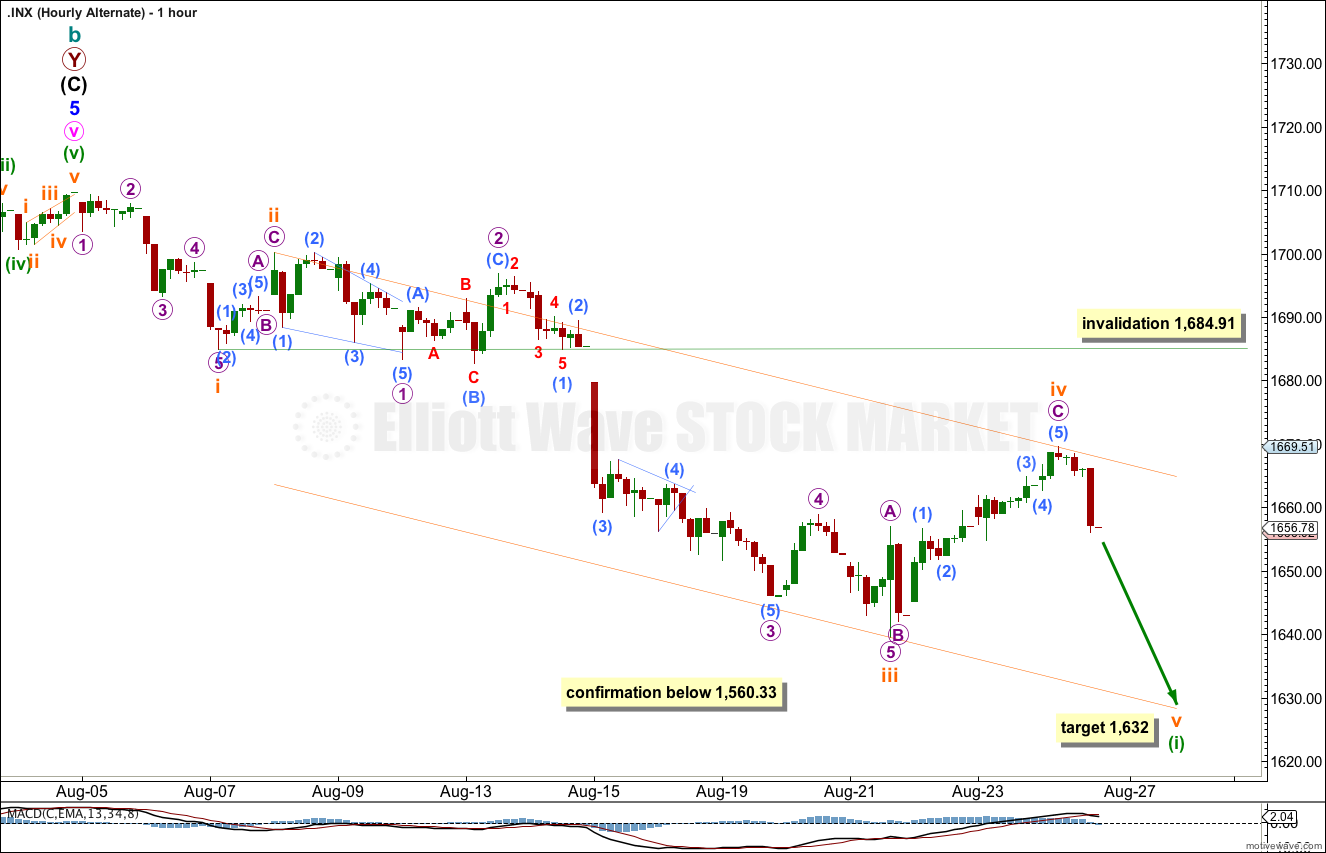
This alternate hourly chart is essentially the same as the main hourly chart in that the subdivisions are the same. A-B-C and 1-2-3 subdivide the same, as 5-3-5. This has the best fit.
For this alternate the upwards movement should be a fourth wave correction. Subminuette wave iv may not move into subminuette wave i price territory. This wave count is invalidated with movement above 1,684.91.
It is also still possible to see the downwards movement ending at 1,639.43 as a five wave impulse. This other possibility would see upwards movement as a second wave correction which may not move beyond the start of the first wave. That possibility would be invalidated only with movement above 1,709.67.
Whats next Lara now that 1632 held?
working on it….
It looks like a double zigzag for minute ii.
But while price remains above 1,560.33 we have to assume the trend remains up.
there’s a gap at the beginning of today’s session to fill anyway…