
Last analysis expected more upwards movement which is what happened. However, we have not seen an increase in momentum, yet.
The wave count remains the same.
Click on the charts below to enlarge.
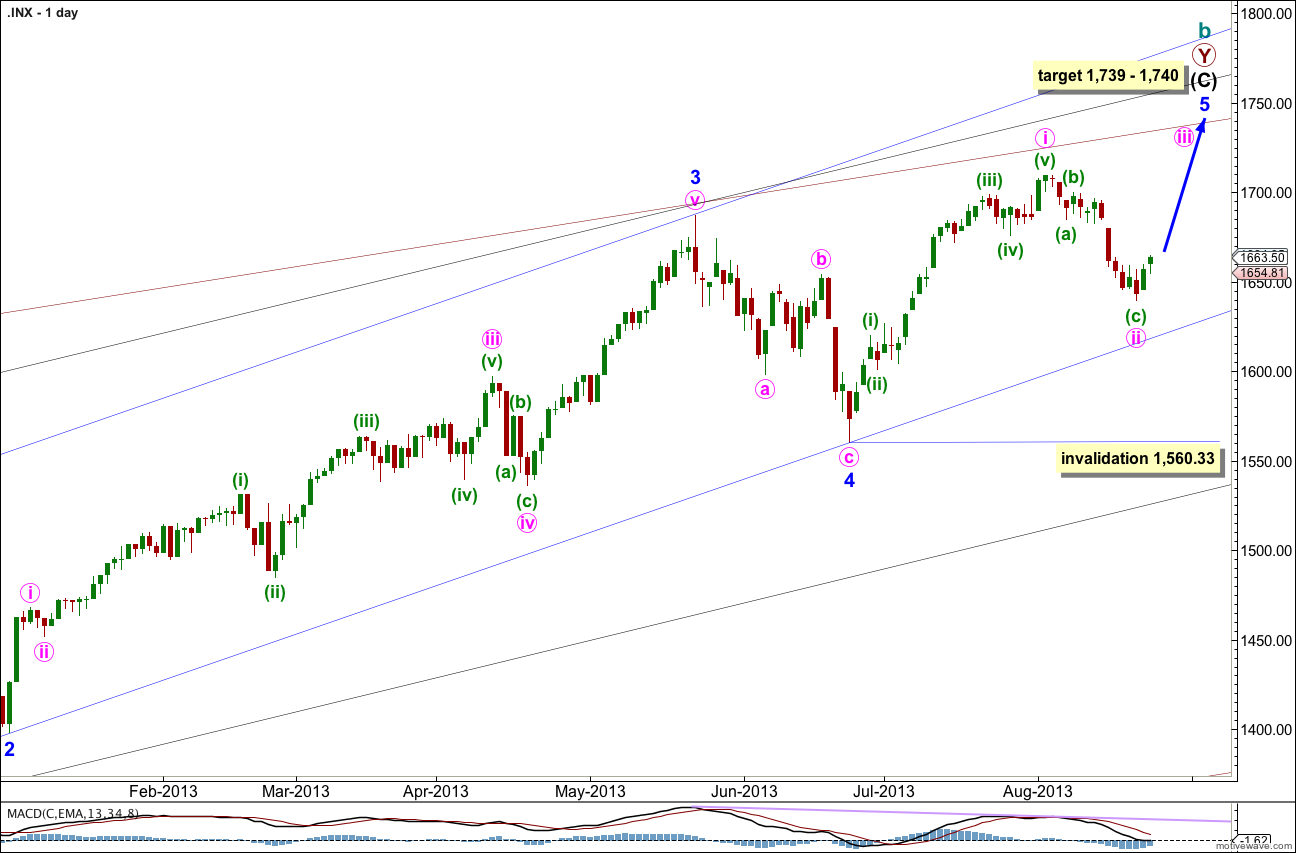
This wave count agrees with MACD and has some nice Fibonacci ratios in price and Fibonacci relationships in time.
Minor wave 3 is 15.1 points longer than 2.618 the length of minor wave 1.
Ratios within minor wave 3 are: there is no Fibonacci ratio between minute waves iii and i, and minute wave v is 5.44 points longer than equality with minute wave iii.
At 1,740 intermediate wave (C) would reach equality with intermediate wave (A). At 1,739 minor wave 5 would reach 0.618 the length of minor wave 3.
Within minor wave 5 minute wave ii may not move beyond the start of minute wave i. This wave count is invalidated with movement below 1,560.33.
Minor wave 1 lasted a Fibonacci 21 days, minor wave 2 lasted a Fibonacci 8 days, minor wave 3 has no Fibonacci duration at 98 days, and minor wave 4 lasted 22 days, just one day longer than a Fibonacci 21.
Minor wave 5 may not exhibit a Fibonacci time relationship. However, the next Fibonacci number in the sequence is 55 which could see minor wave 5 ending on 10th September (give or take a day or two either side). This may be the next possibility. At that time I will see if the structure could be considered complete, or not.
Keep drawing the wider parallel channels from the monthly chart and copy them over to the daily chart.
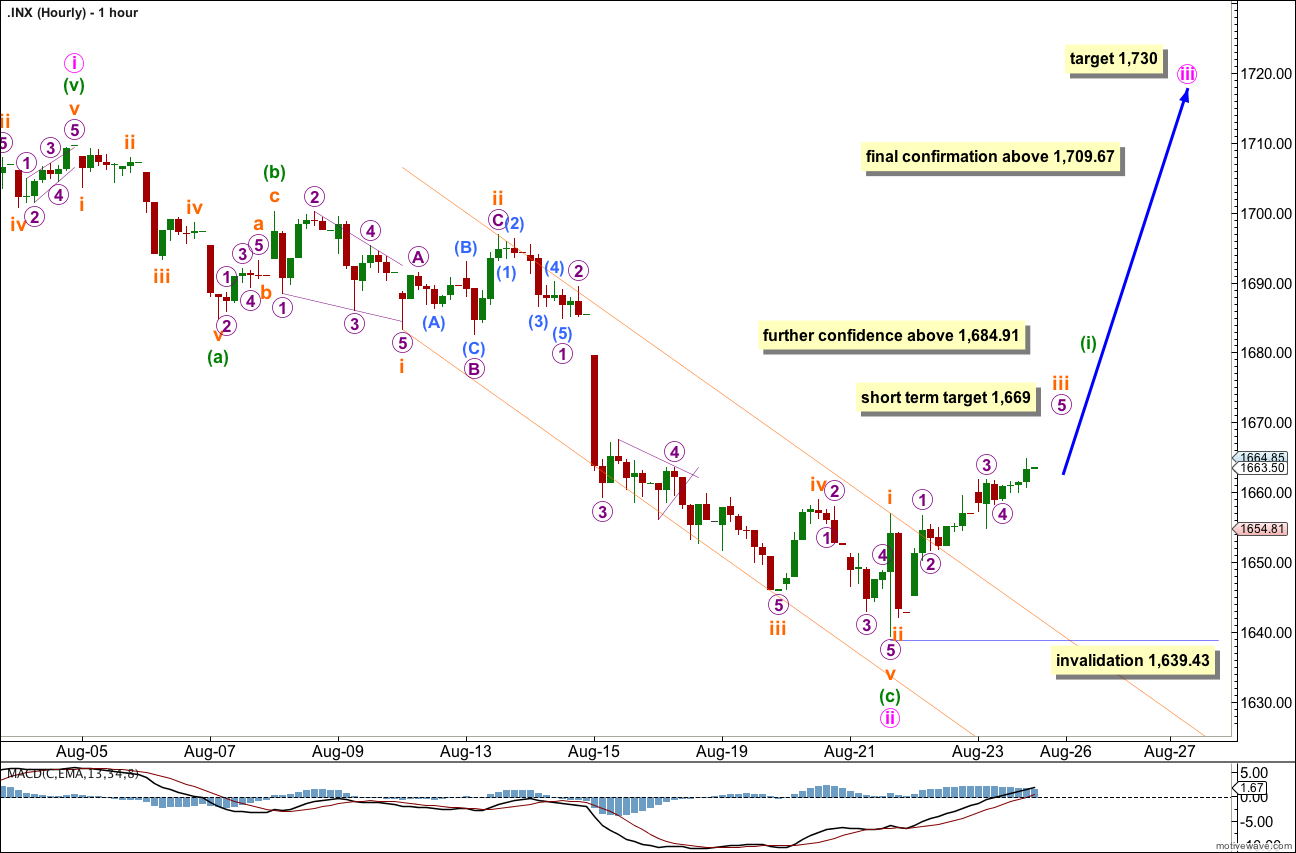
Within minute wave iii minuette wave (i) is incomplete. Subminuette wave iii may end next session. At 1,669 micro wave 5 would reach equality with micro wave 3, and subminuette wave iii would reach 1.618 the length of subminuette wave i.
The following correction for subminuette wave iv should be shallow, because subminuette wave ii was very deep.
At 1,730 minute wave iii would reach 0.618 the length of minute wave i. I am considering this Fibonacci ratio because minute wave i is clearly extended, so minute waves iii and v may not be.
Movement above 1,684.91 would provide further confidence in this wave count as at that stage the best fit for the alternate below would be invalidated.
Movement above 1,709.67 would provide final confirmation that this wave count is correct. At that stage we may have full confidence in targets on the daily and hourly charts.
Within minute wave iii minuette wave (ii) may not move beyond the start of minuette wave (i). This wave count is invalidated with movement below 1,639.43.
Alternate Wave Count.
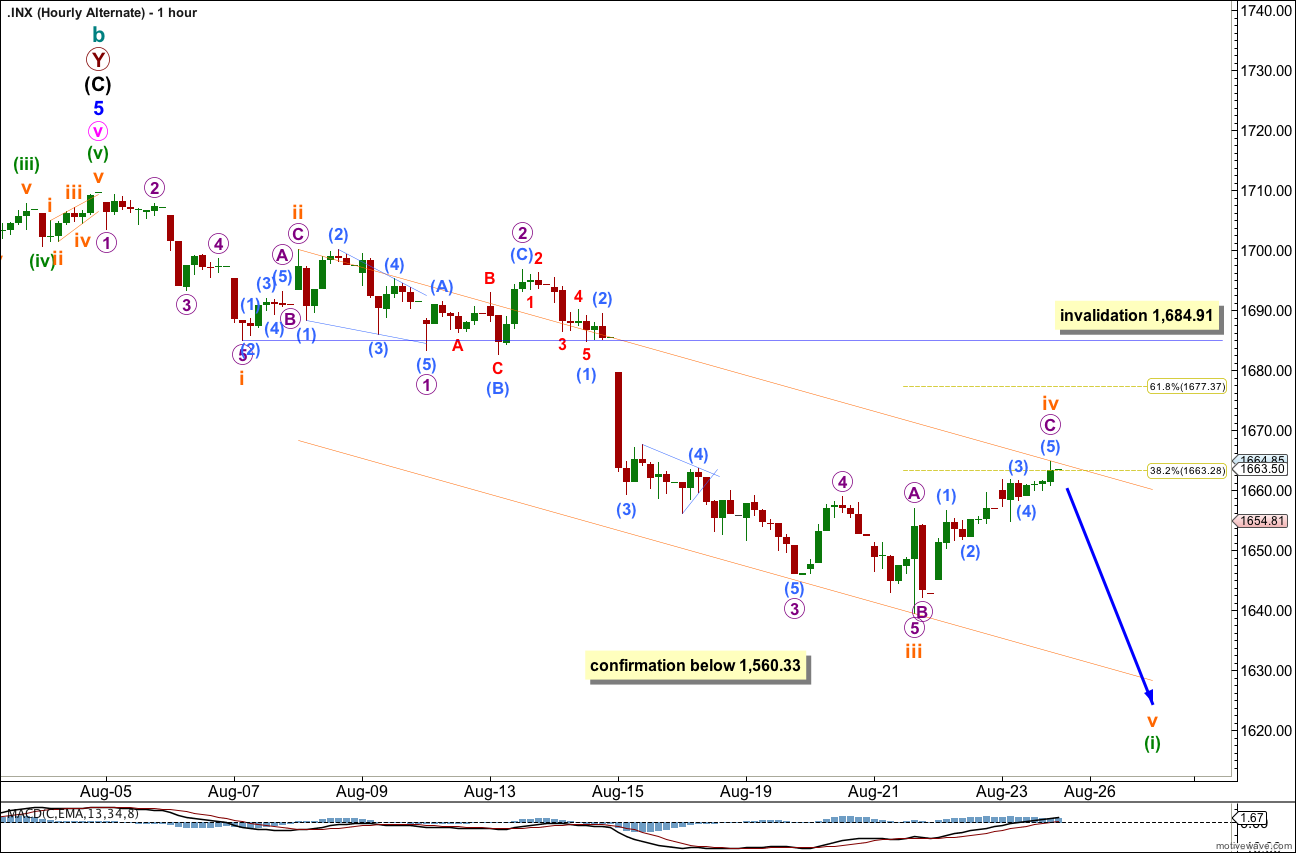
While price remains below 1,709.67 it will remain possible that we have recently seen a trend change at cycle degree. However, we should always assume the trend remains the same until proven otherwise.
We should assume the trend is upwards until this wave count is confirmed with movement below 1,560.33, and then with a breach of the black parallel channel on the daily chart.
This alternate hourly chart is essentially the same as the main hourly chart in that the subdivisions are the same. A-B-C and 1-2-3 subdivide the same, as 5-3-5. This has the best fit.
For this alternate the upwards movement should be a fourth wave correction. Subminuette wave iv may not move into subminuette wave i price territory. This wave count is invalidated with movement above 1,684.91.
It is also still possible to see the downwards movement ending at 1,639.43 as a five wave impulse. This other possibility would see upwards movement as a second wave correction which may not move beyond the start of the first wave. That possibility would be invalidated only with movement above 1,709.67.