
Last week’s analysis had three hourly charts. The first expected a little upwards movement to 470.12 or above before more downwards movement, and the second expected a third wave upwards. The second chart had a target at 507.39 which was exceeded by 6.35. The third chart was invalidated with movement above 471.89.
Click on the charts below to enlarge.
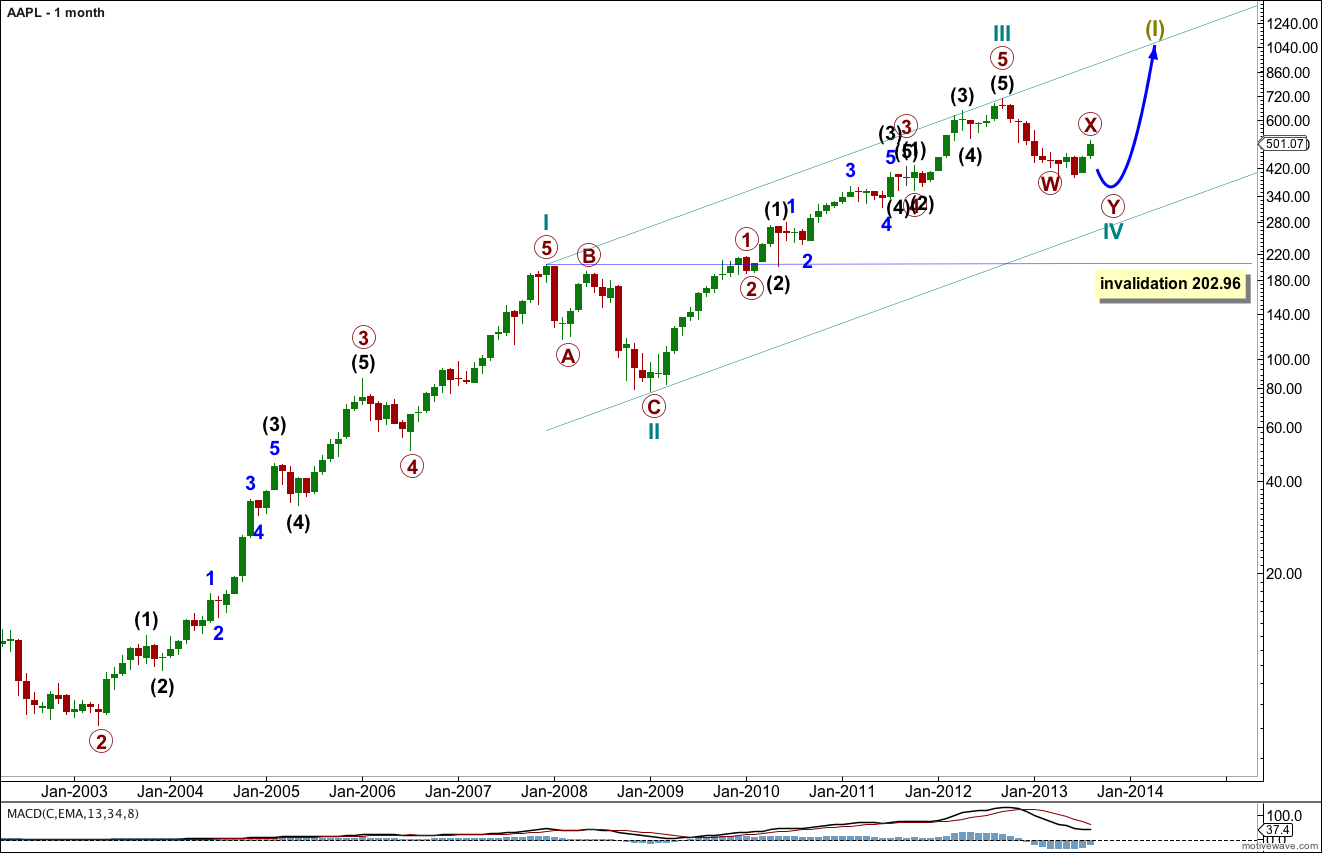
If the monthly chart is viewed on a semi-log scale then recent downwards movement looks proportional to cycle wave II and it may be cycle wave IV.
On a semi-log scale there is no trend channel breach. The channel is drawn from the highs of cycle waves I to III, a parallel copy is placed upon the low of cycle wave II. Cycle wave IV may find support at the lower edge of this channel.
There is no Fibonacci ratio between cycle waves III and I.
Ratios within cycle wave III are: primary wave 3 is 10.31 longer than 1.618 the length of primary wave 1, and primary wave 5 is 8.86 short of 2.618 the length of primary wave 1.
Ratios within primary wave 3 are: intermediate wave (3) is 9.98 short of 2.618 the length of intermediate wave (3), and intermediate wave (5) has no Fibonacci ratio to intermediate waves (3) or (1).
Ratios within intermediate wave (3) of primary wave 3 are: minor wave 3 is just 0.29 short of 1.618 the length of minor wave 1, and minor wave 5 has no Fibonacci ratio to either of minor waves 3 or 1.
Ratios within primary wave 5 are: intermediate wave (3) has no Fibonacci ratio to intermediate wave (1), and intermediate wave (5) is 6.81 short of 2.618 the length of intermediate wave (1).
If a cycle degree fourth wave correction is unfolding then it is unlikely to be over in just 7 months at the low labeled here primary wave W. The first zigzag is completed, and because of the brevity and shallow correction a second zigzag should be expected. Also, a new low below the end of primary wave W confirms this correction cannot be over.
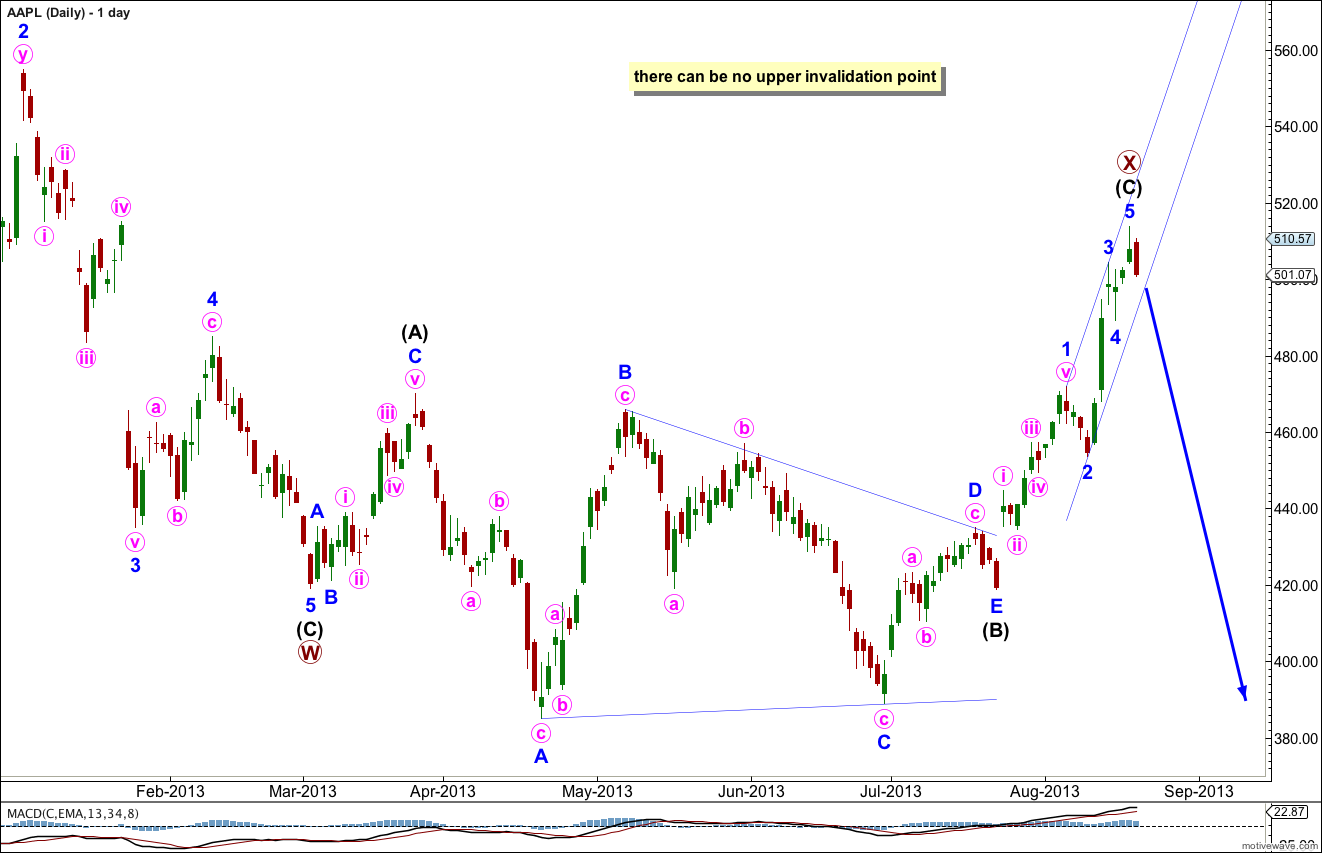
Primary wave X within the double zigzag of cycle wave IV may have completed. Alternatively, it may yet move a little higher. I have two hourly wave counts for you this week looking at both possibilities and the price points which differentiates the two are 513.74 and 471.89.
At the low labeled primary wave W this downwards wave subdivides perfectly as a three wave zigzag. Because a new low was made after this zigzag was completed cycle wave IV cannot be over there, it must be continuing.
At cycle degree the structure unfolding may be a double zigzag, double combination or a flat (which would be labeled A-B-C instead of W-X-Y).
If this structure is an unfolding flat correction then primary wave B (labeled here as primary wave X) would need to reach up to a minimum of 90% the length of primary wave A at 676. Because this would give the flat correction that is unfolding at primary wave degree an odd look this is unlikely. What would have a more typical look is only a little more upwards movement, or none, and for the next corrective structure downwards to unfold at primary wave degree as a zigzag making cycle wave IV a double zigzag.
At this stage primary wave X is a flat correction because intermediate wave (A) within it subdivides as a three wave zigzag, and intermediate wave (B) is a corrective structure that is just over 100% the length of intermediate wave (A). So far intermediate wave (C) subdivides nicely as a five wave impulse and has no Fibonacci ratio with intermediate wave (A).
Main Hourly Wave Count.
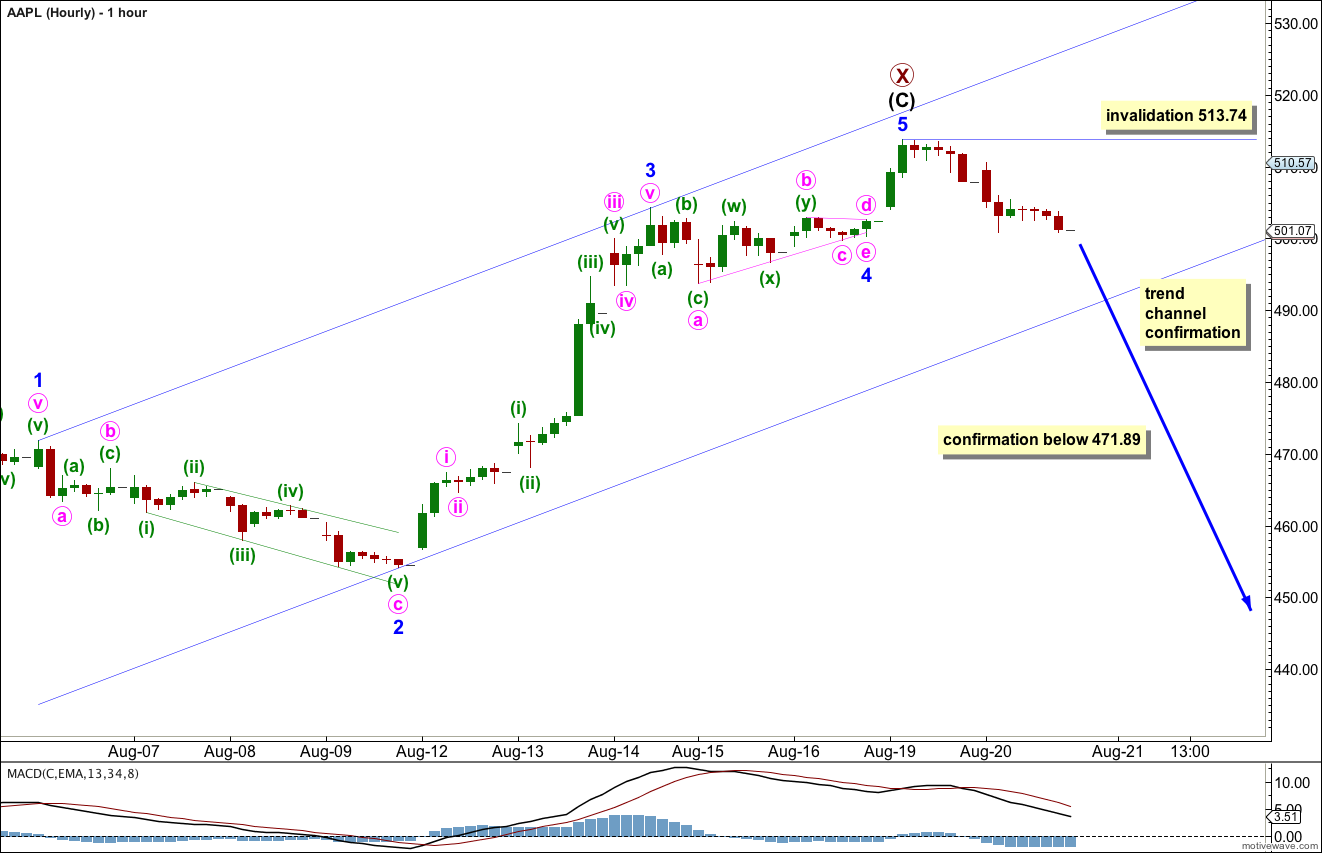
This week I favour this first hourly chart because it has a better overall look, the proportions have a better fit.
Primary wave X may be a completed regular flat correction.
Ratios within intermediate wave (C) are: minor wave 3 is 3.14 longer than equality with minor wave 1, and minor wave 5 is 0.95 longer than 0.236 the length of minor wave 1.
Ratios within minor wave 3 are: minute wave iii is 0.64 longer than 2.618 the length of minute wave i, and minute wave v has no Fibonacci ratio to either of minute waves i or iii.
Ratios within minute wave iii of minor wave 3 are: minuette wave (iii) is 1.45 longer than 2.618 the length of minuette wave (i), and minuette wave (v) is 0.75 longer than equality with minuette wave (i).
Minor waves 2 and 4 have perfect alternation: minor wave 2 was a 33% zigzag correction of minor wave 1, and minor wave 4 was a very shallow 8% barrier triangle.
The barrier triangle was followed by a brief sharp movement for the fifth wave which is typical following barrier triangles.
Movement below the parallel channel containing intermediate wave (C) would provide trend channel confirmation of a trend change. Further movement below 471.89 would provide price confirmation.
Within the first wave downwards of primary wave Y no second wave correction may move beyond the start of the first wave. This wave count is invalidated with movement above 513.74.
Alternate Hourly Wave Count.
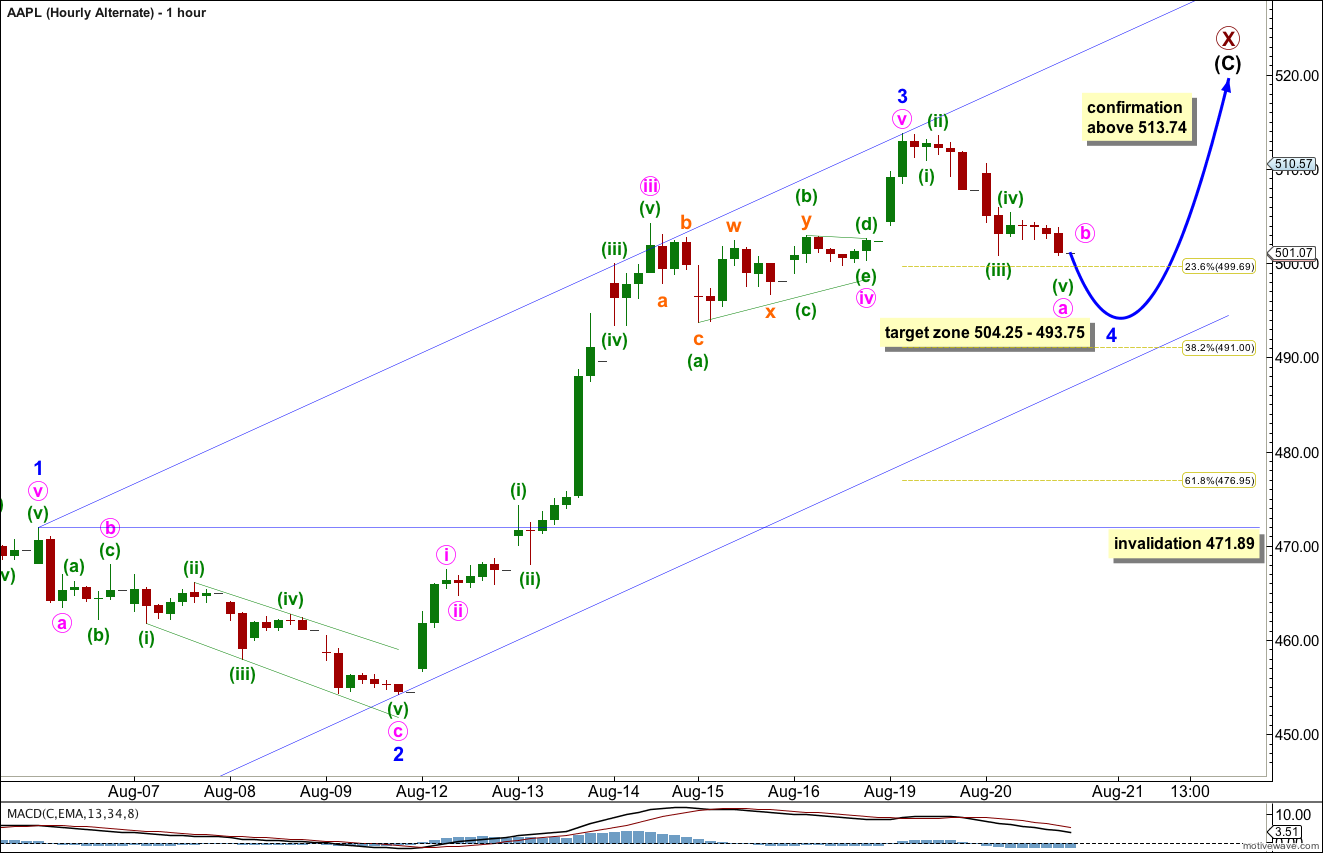
It is possible that intermediate wave (C) is incomplete. However, this alternate has a lower probability than the first chart above because minor wave 3 does not look like a clear five wave impulse, it has an overall three wave look to it.
If minor wave 3 has more recently ended then it has no Fibonacci ratio to minor wave 1.
Ratios within minor wave 3 are: minute wave iii has no Fibonacci ratio to minute wave i, and minute wave v is 0.76 longer than equality with minute wave i.
Within minute wave iii within minor wave 3 there are no adequat Fibonacci ratios between minuette waves (i), (iii) and (v).
This wave count has significantly fewer Fibonacci ratios than the first wave count which further reduces its probability. I would only consider it if we see movement above 513.74.
Within this alternate minor wave 4 may not move into minor wave 1 price territory. This wave count is invalidated with movement below 471.89.
Hi Lara,
Are you thinking appl will make a new low before it’ goes to a new high or the downward move will stop short of a new low?
Do you have a target for the low before travelling north?
Thanks.
I’m working on my update to AAPL now.
I hope to publish it tonight.
Posted here before but not sure if my comment was logged. Sorry for any repetition. In your first chart above, in the upwards channel) are you suggesting that AAPL will or can move above $1000.00.
Thank you!
Eventually, yes.
Primary wave Y downwards has to complete first. That may take six months or so.
Then a new wave upwards should begin which is most likely to make new highs.
Thanks! Much appreciated!