
Thursday’s analysis expected some upwards movement for a correction, before overall downwards movement for Friday. Price moved lower in very choppy movement.
Both wave counts remain the same. We do not have confirmation of a trend change at this stage.
Click on the charts below to enlarge.
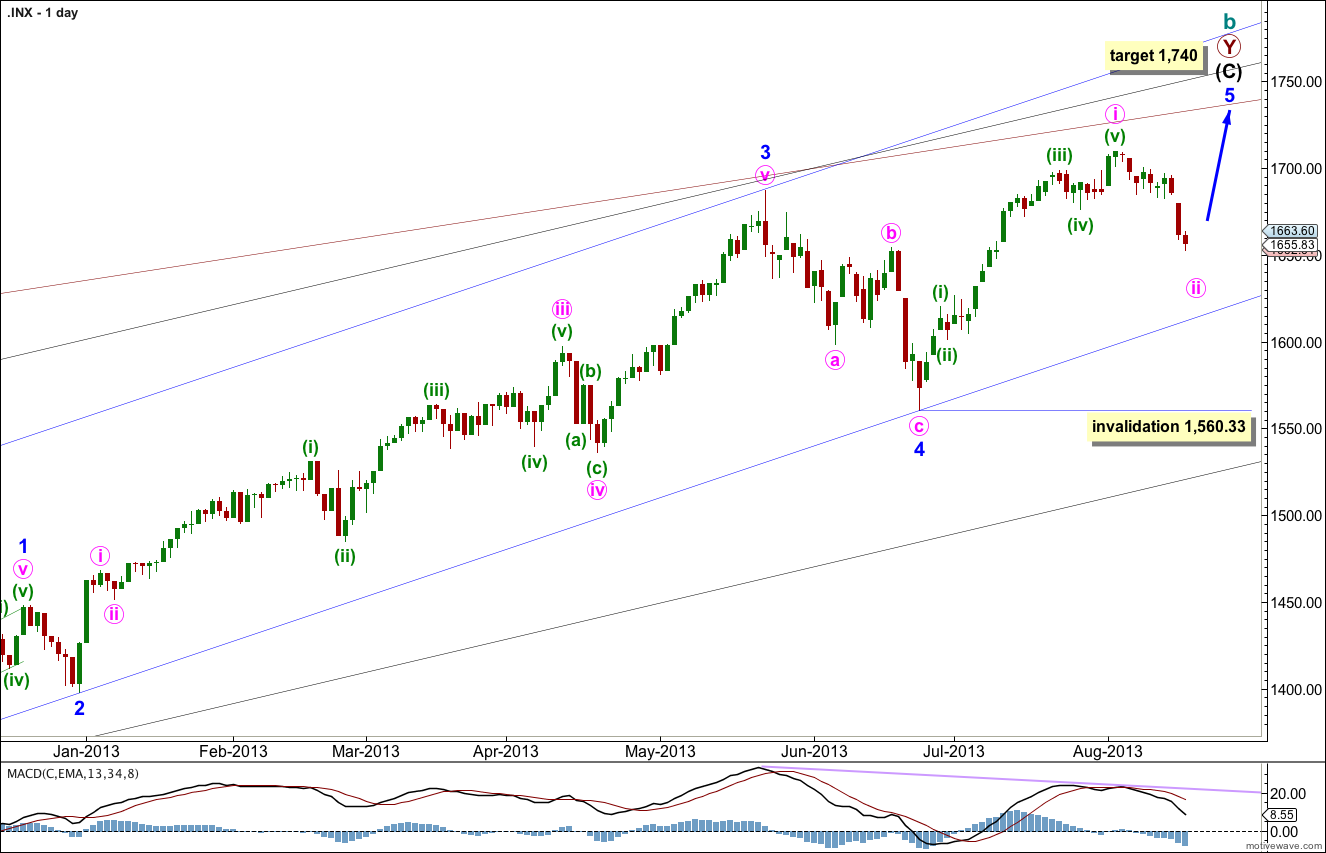
This wave count agrees with MACD and has some nice Fibonacci ratios in price and Fibonacci relationships in time.
Minor wave 3 is 15.1 points longer than 2.618 the length of minor wave 1.
Ratios within minor wave 3 are: there is no Fibonacci ratio between minute waves iii and i, and minute wave v is 5.44 points longer than equality with minute wave iii.
At 1,740 intermediate wave (C) would reach equality with intermediate wave (A).
Within minor wave 5 minute wave ii may not move beyond the start of minute wave i. This wave count is invalidated with movement below 1,560.33.
Minor wave 1 lasted a Fibonacci 21 days, minor wave 2 lasted a Fibonacci 8 days, minor wave 3 has no Fibonacci duration at 98 days, and minor wave 4 lasted 22 days, just one day longer than a Fibonacci 21.
Minor wave 5 may not exhibit a Fibonacci time relationship. However, the next Fibonacci number in the sequence is 55 which could see minor wave 5 ending on 10th September (give or take a day or two either side). This may be the next possibility. At that time I will see if the structure could be considered complete, or not.
Keep drawing the wider parallel channels from the monthly chart and copy them over to the daily chart.
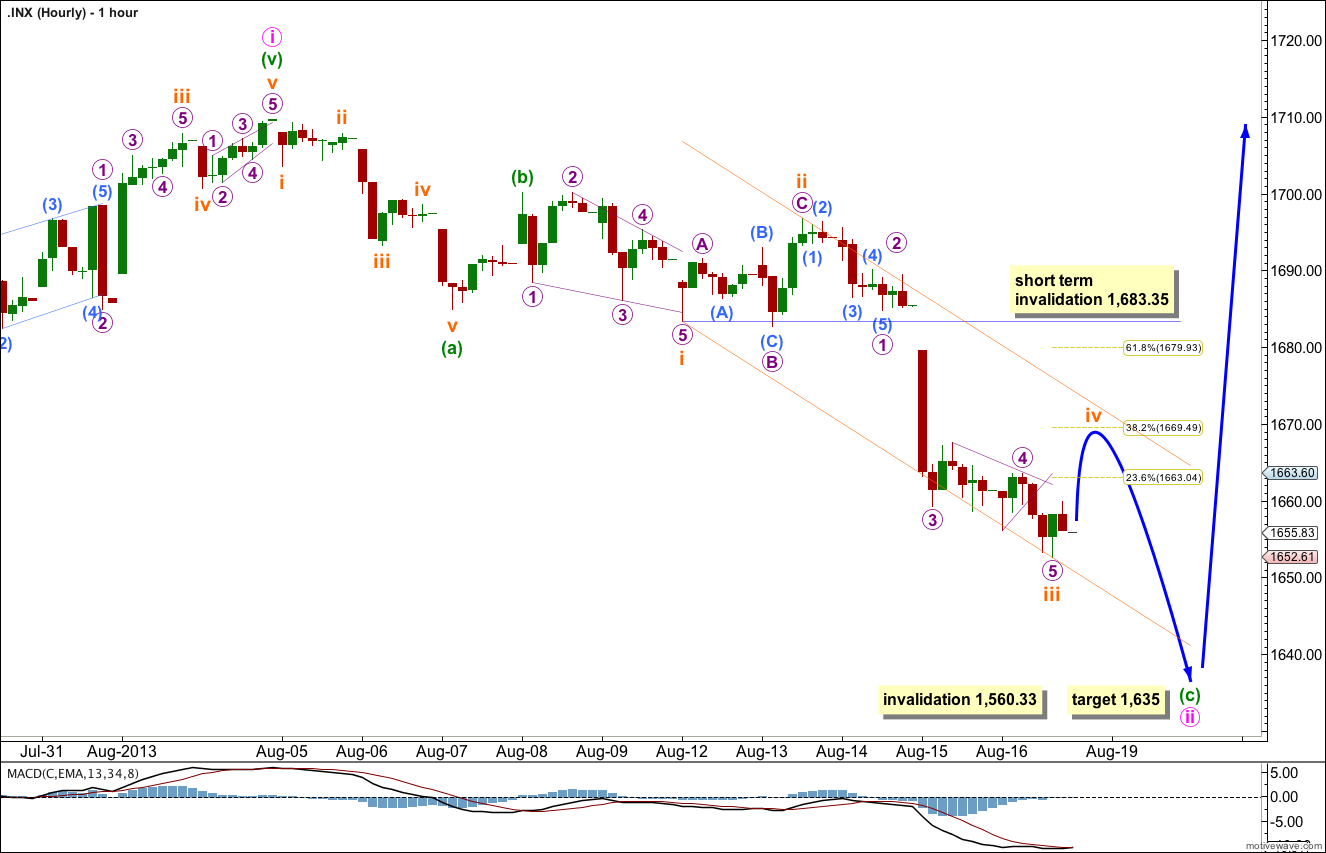
Downwards movement for Friday’s session was a continuation of subminuette wave iii. Subminuette wave iii is now just 0.14 points longer than 2.618 the length of subminuette wave i.
Ratios within subminuette wave iii are: micro wave 3 is 0.99 points longer than 2.618 the length of micro wave 1, and micro wave 5 has no Fibonacci ratio to either of micro waves 3 or 1.
Subminuette wave iv should show on the daily chart as a green candlestick so I would expect it to take all or most of Monday’s session, and possibly even Tuesday depending upon what structure unfolds.
Subminuette wave ii was an expanded flat correction: micro wave B was a 109% correction of micro wave A, and micro wave C was 1.02 points longer than 1.618 the length of micro wave A. Subminuette wave ii was a deep 80% correction of subminuette wave i.
We should expect subminuette wave iv to show alternation with subminuette wave ii. It should be shallow ending about the 0.236 or 0.382 Fibonacci ratio of subminuette wave iii. It is most likely to be a zigzag, triangle or combination.
When subminuette wave iv is completed then one final wave downwards for subminuette wave v would complete the zigzag structure for minute wave ii. At 1,635 minuette wave (c) would reach 2.618 the length of minuette wave (a).
Minute wave ii may not move beyond the start of minute wave i. This wave count is invalidated with movement below 1,560.33.
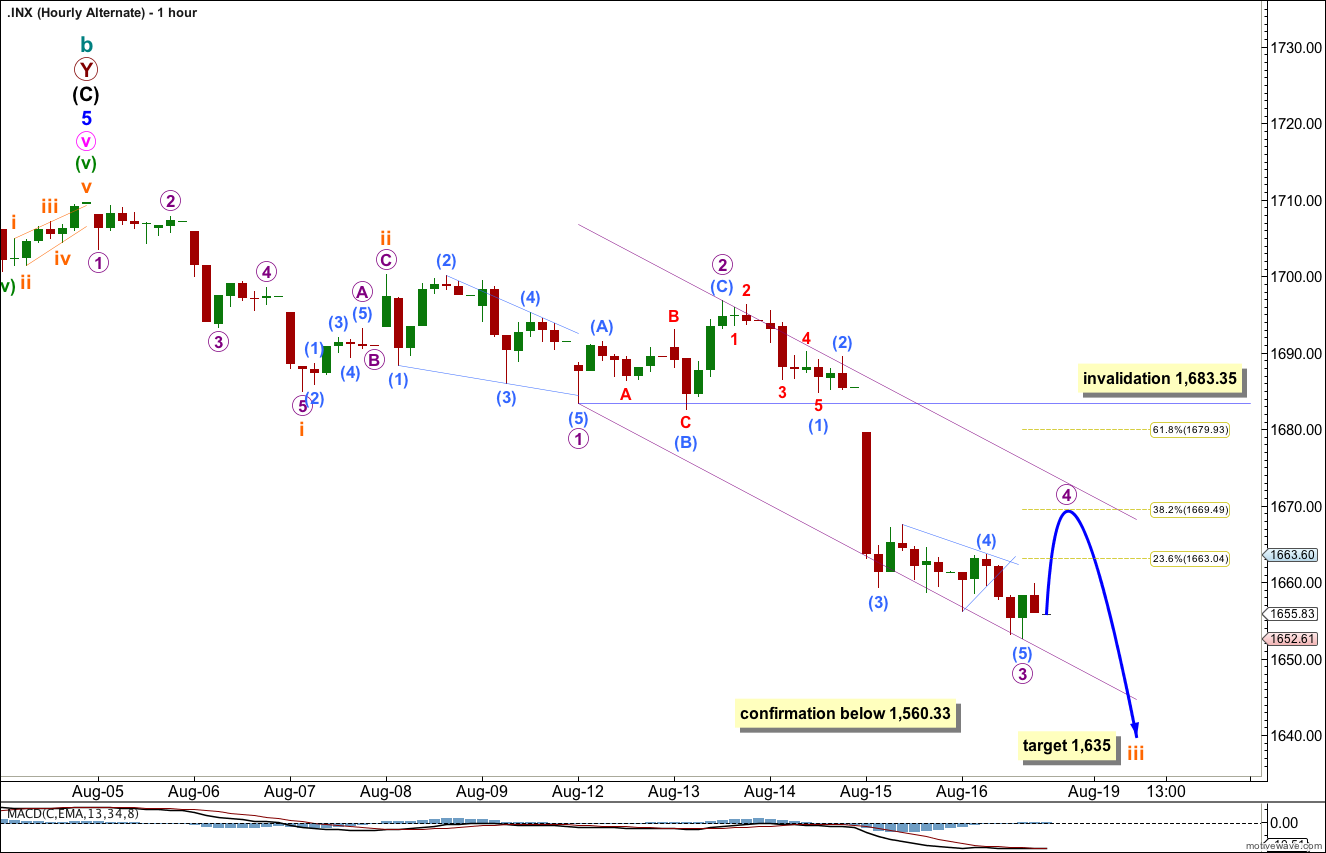
Alternate Wave Count.
While price remains below 1,709.67 it will remain possible that we have recently seen a trend change at cycle degree. However, we should always assume the trend remains the same until proven otherwise.
We should assume the upwards trend remains valid until this wave count is confirmed with movement below 1,560.33, and then with a breach of the black parallel channel on the daily chart.
The recent increase in downwards momentum fits nicely with this wave count, but it is not enough to confirm it.
The subdivisions of this hourly wave count are the same as for the main wave count because A-B-C and 1-2-3 both subdivide in exactly the same way, 5-3-5.
At 1,635 subminuette wave iii would reach 2.618 the length of subminuette wave i.
Micro wave 4 may not move into micro wave 1 price territory. This wave count is invalidated with movement above 1,683.35.
Is that possible that 2009 low is super cycle wave 4 and now in super cycle wave 5? Thanks.
Yes, it is possible. This is my alternate monthly wave count which you can see in SPX Historical Analysis category.
If this is part of a bull market it should be moving into a third wave now and so this next upwards wave should show an increase in momentum (using MACD as an indicator). If it does then this alternate will be seriously considered. But if it does not then this main wave count is more likely.
Both ideas expect upwards movement at least to about 1,740.