
Yesterday’s analysis expected upwards movement from the main hourly wave count which is what happened.
The alternate requires confirmation before we may have any confidence in it whatsoever.
Click on the charts below to enlarge.
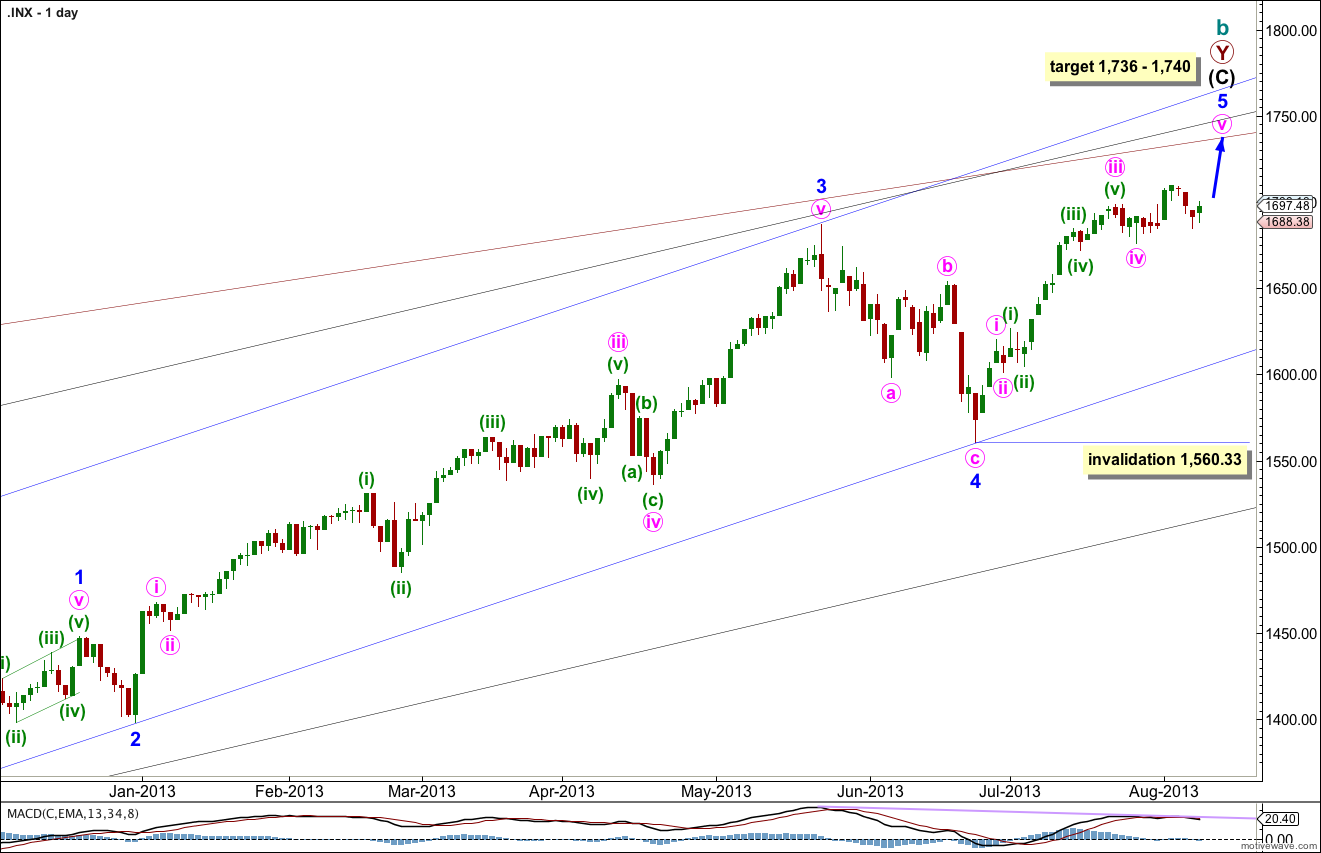
This wave count agrees with MACD and has some nice Fibonacci ratios in price and Fibonacci relationships in time.
Minor wave 3 is 15.1 points longer than 2.618 the length of minor wave 1.
Ratios within minor wave 3 are: there is no Fibonacci ratio between minute waves iii and i, and minute wave v is 5.44 points longer than equality with minute wave iii.
At 1,740 intermediate wave (C) would reach equality with intermediate wave (A). At 1,739 minor wave 5 would reach 0.618 the length of minor wave 3. At 1,736 minute wave v would reach 0.618 the length of minute wave iii.
Within minor wave 5 no second wave correction may move beyond the start of the first wave. This wave count is invalidated with movement below 1,560.33.
Minor wave 1 lasted a Fibonacci 21 days, minor wave 2 lasted a Fibonacci 8 days, minor wave 3 has no Fibonacci duration at 98 days, and minor wave 4 lasted 22 days, just one day longer than a Fibonacci 21.
At this stage minor wave 5 has lasted 32 sessions. A further two sessions would see it ending in a Fibonacci 34 (give or take one session either side of this would be an acceptable variation). At this stage I do not think this structure can complete in just two or three sessions. Minor wave 5 may not exhibit a Fibonacci duration.
Keep drawing the wider parallel channels from the monthly chart and copy them over to the daily chart.
Main Hourly Wave Count.
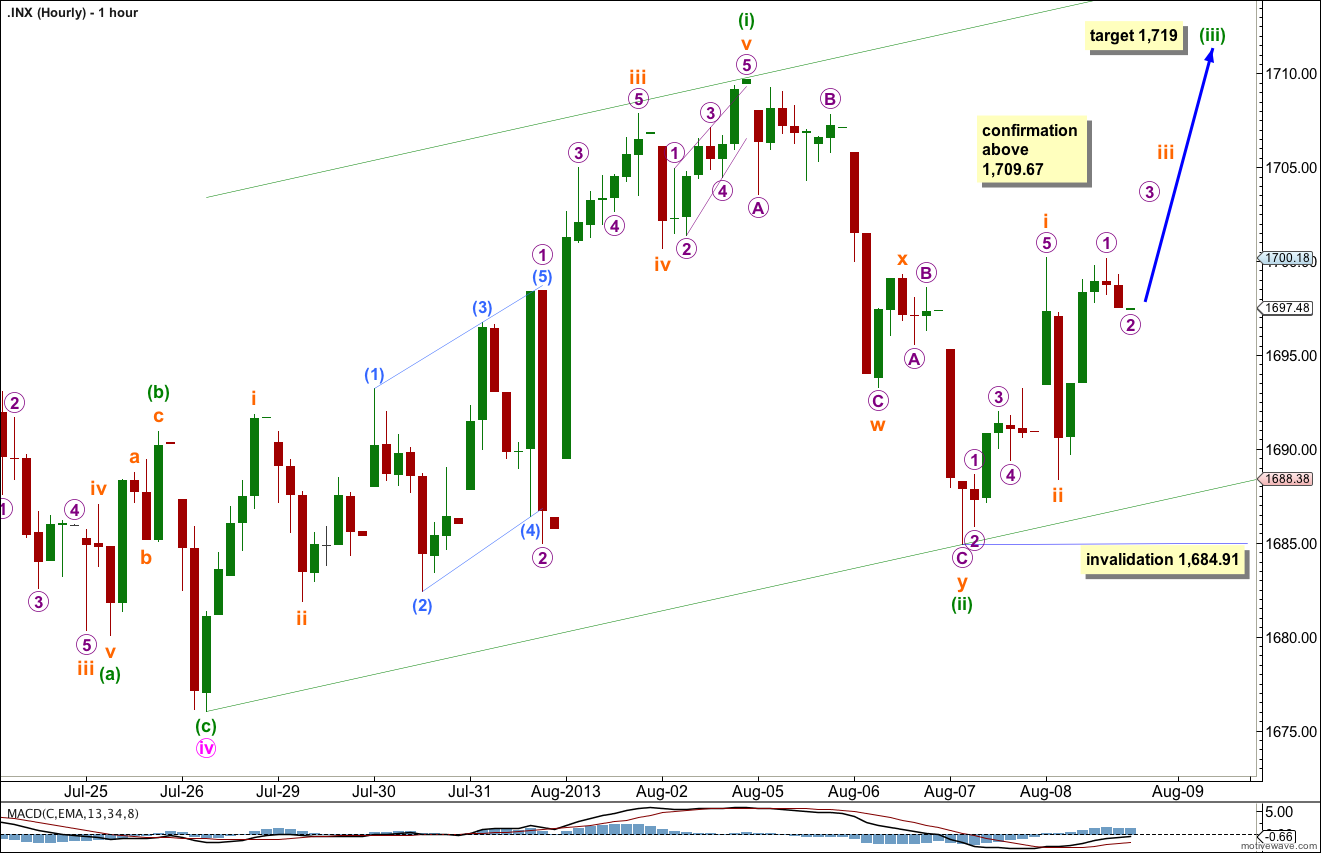
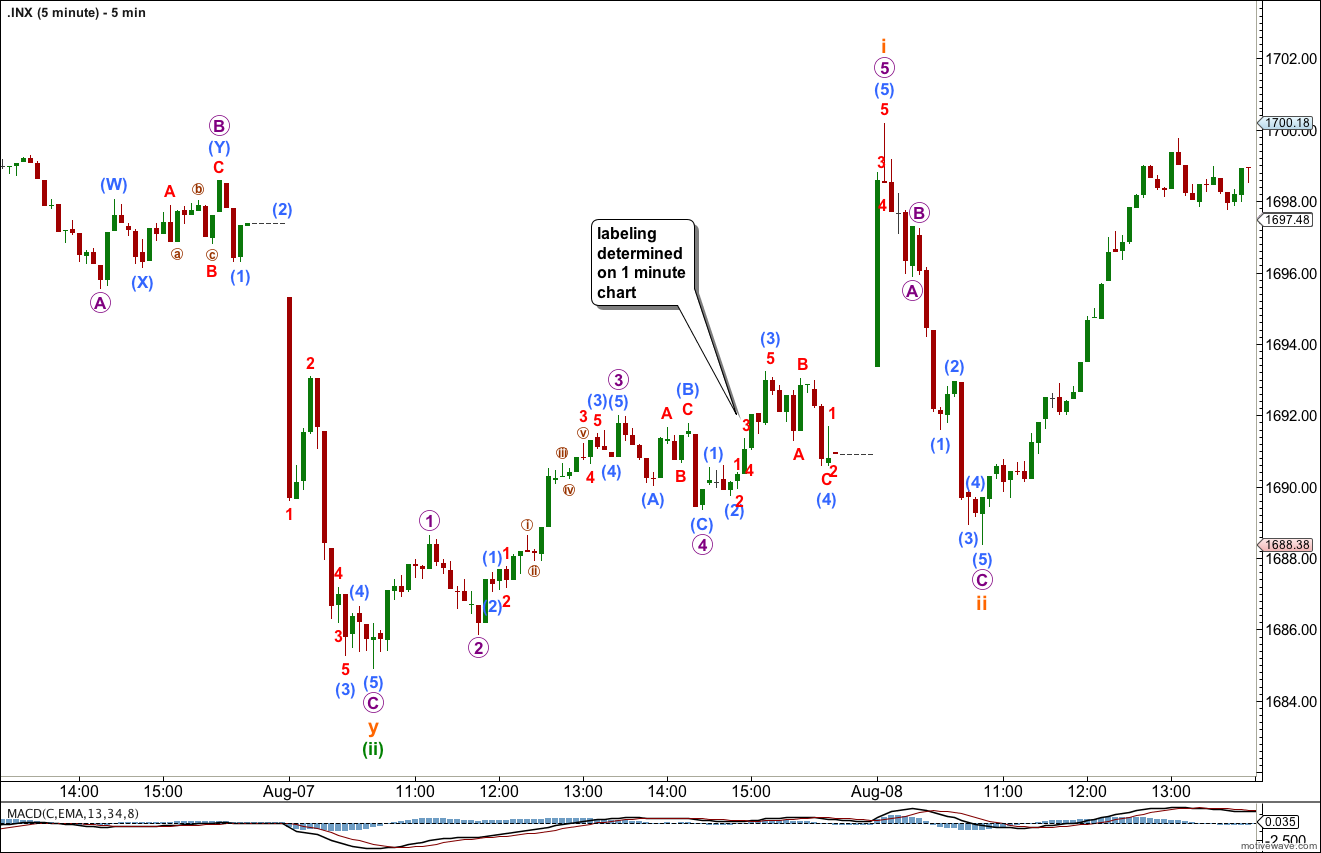
The upwards movement labeled subminuette wave i may be seen as either a three or a five wave structure. It is ambiguous. So we must consider wave counts which look at both possibilities.
Minuette wave (iii) may only subdivide into an impulse. At 1,719 it would reach equality in length with minuette wave (i).
This wave count would be strongly confirmed with movement above 1,709.67.
Within minuette wave (iii) subminuette wave ii may not move beyond the start of subminuette wave i. This main wave count is invalidated with movement below 1,684.91.
If price moves below 1,684.91 tomorrow then minuette wave (ii) is not over as a double zigzag and may be continuing further. Use the next chart below.
If we see the downwards movement labeled subminuette wave a as a five and not a double three, and the upwards movement labeled subminuette wave b as a three, then it is possible that minuette wave (ii) is not over and is unfolding as a large single zigzag.
The biggest problem with this wave count (and the next alternate hourly wave count below) is the structure of subminuette wave a. This can be seen as a five wave structure, but in doing so both micro waves 2 and 4 within it have truncated C waves or are combinations, and there is absolutely no alternation between these two corrections. This reduces the probability that labeling this piece of movement as an impulse is correct.
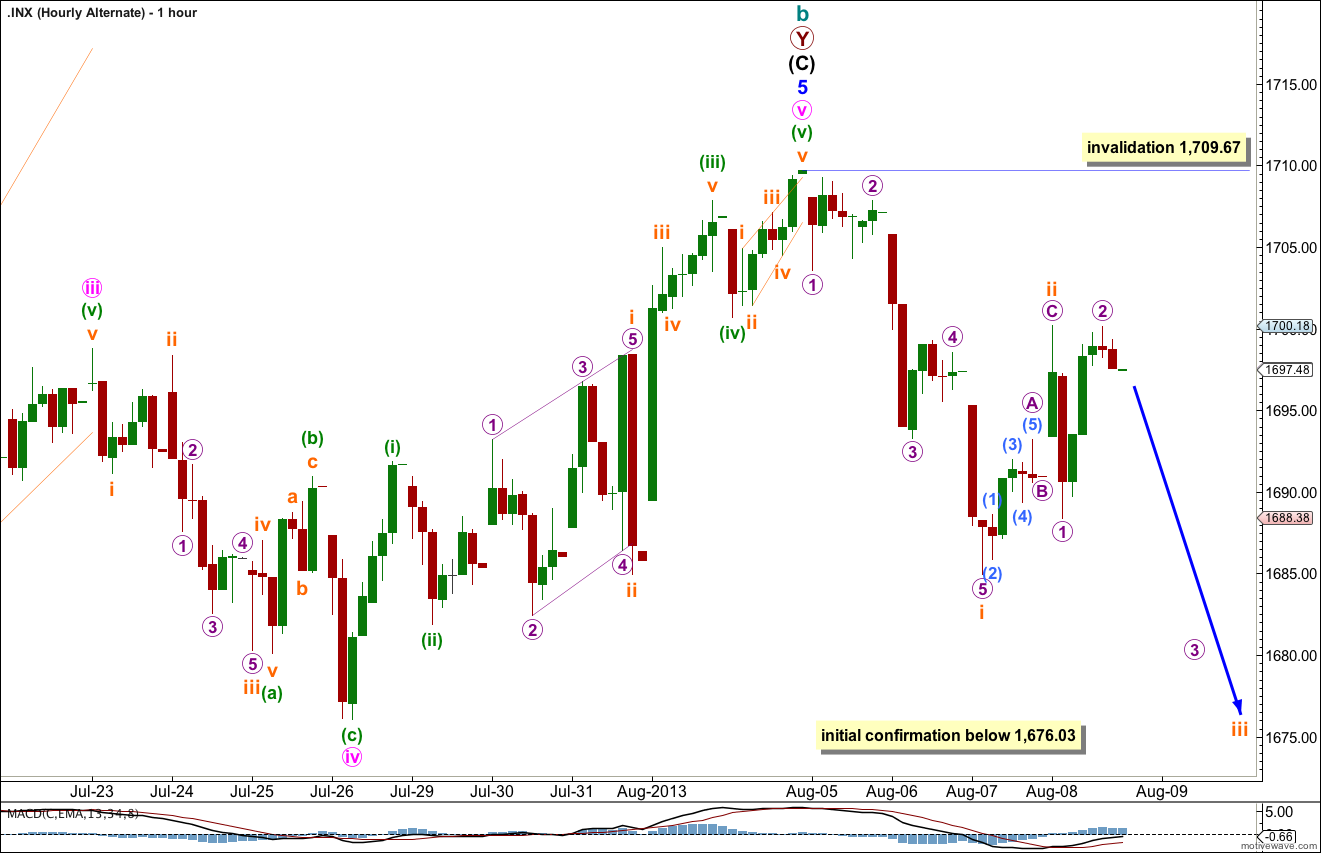
Minuette wave (ii) may not move beyond the start of minuette wave (i). This wave count is invalidated with movement below 1,676.03.
If this wave count is invalidated with movement below 1,676.03 then we may use the alternate below.
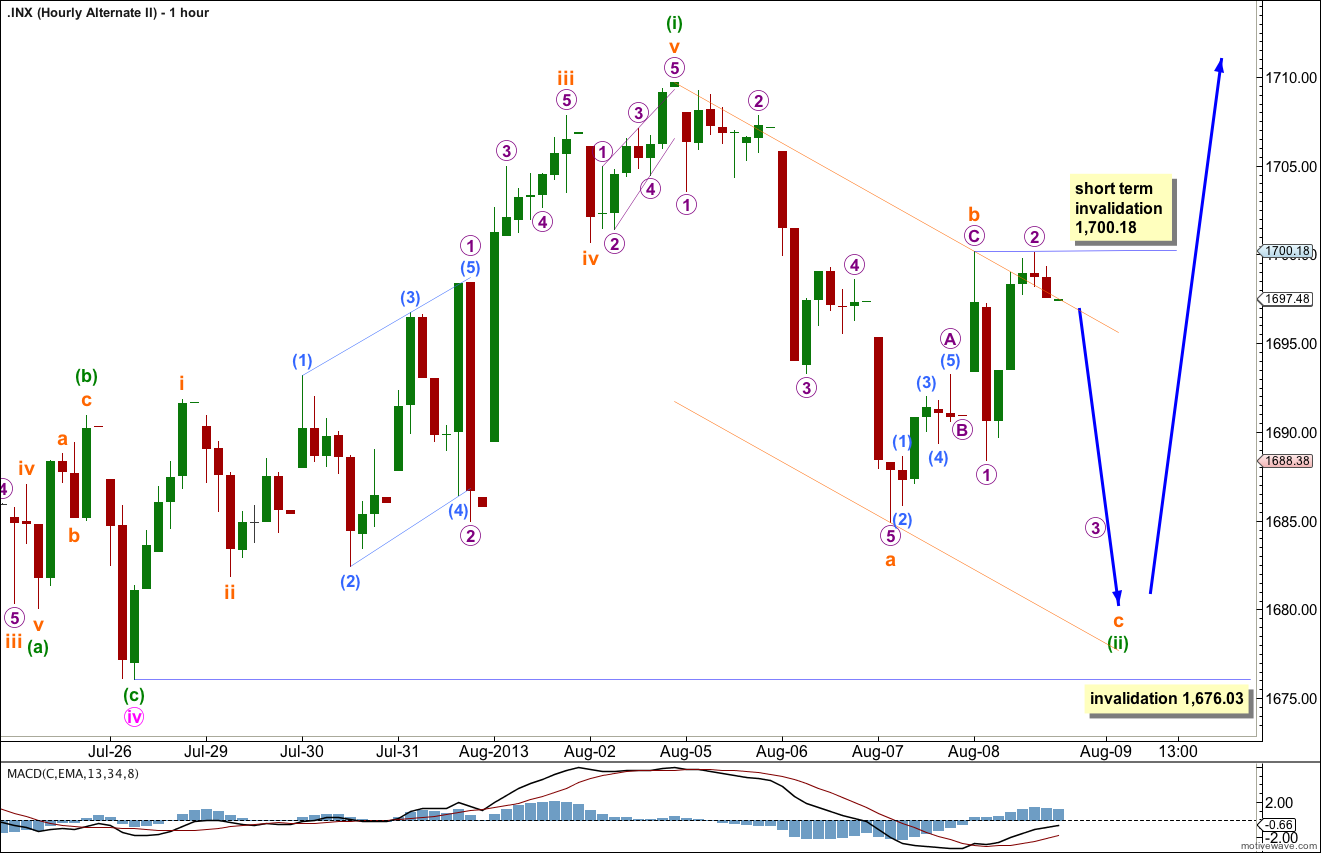
Alternate Hourly Wave Count.
This alternate suffers from the same problem as the second chart for the main wave count in that the downwards movement labeled here as subminuette wave i does not fit well as an impulse. There is no alternation between micro waves 2 and 4.
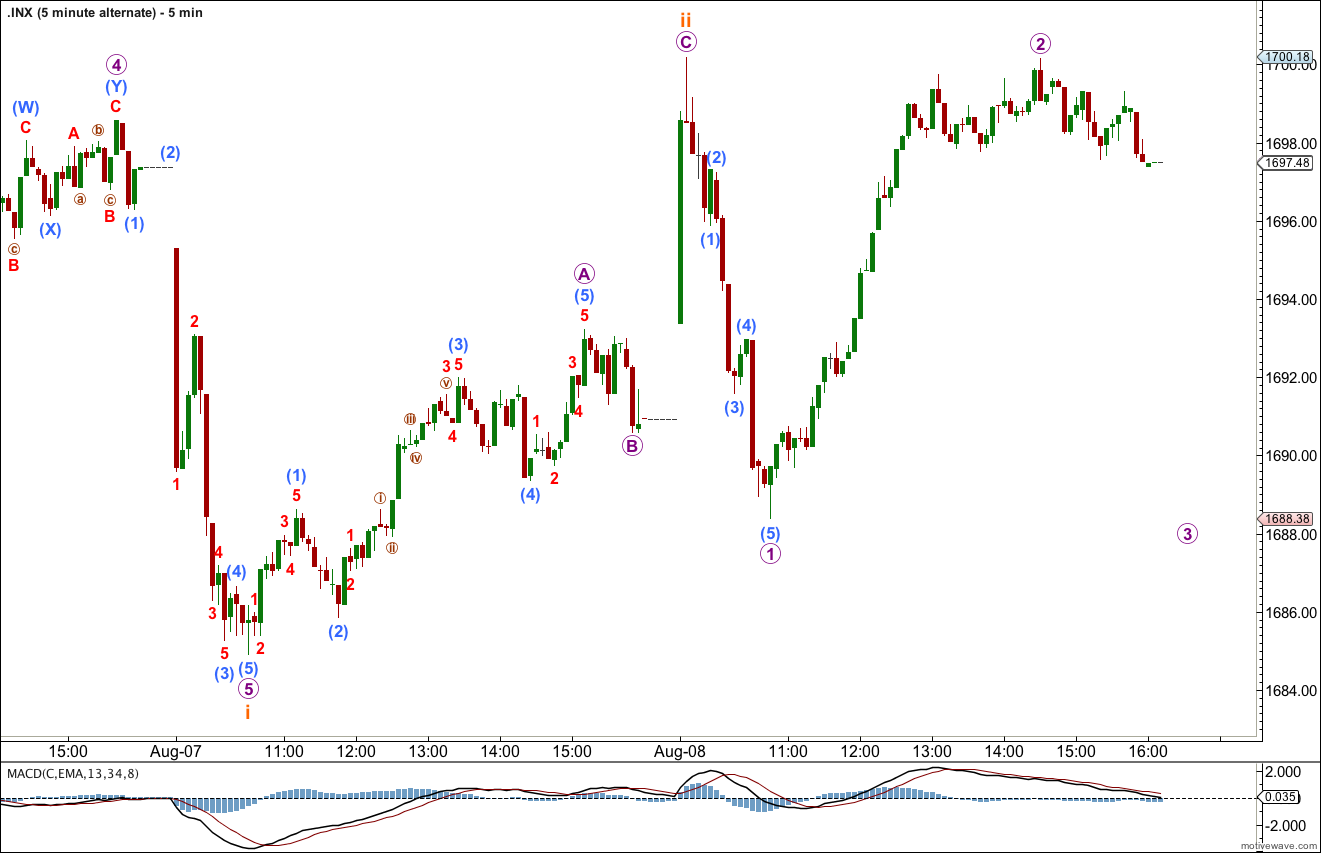
Subminuette wave ii may or may not be over, depending upon how we view the upwards movement labeled subminuette wave ii. If it is a three wave zigzag (which has a better fit on the five minute chart) then it is over. If it is a five wave impulse then it should continue higher.
Subminuette wave ii may not move beyond the start of subminuette wave i. This wave count is invalidated with movement above 1,709.67.
Initially we would need to see movement below 1,676.03 to invalidate the main hourly wave count. Further movement below 1,560.33 would be required to confirm this wave count and provide confidence in a trend change. While price remains above 1,560.33 I have no confidence we have had a trend change.
Five Minute Charts.
As an illustration of the difficulty in analysis when a movement is ambiguous I will publish my five minute charts today. The first looks at the upwards movement from 1,684.91 to 1,700.18 as a three, and the second looks at the same upwards movement as a five.
1705 Channel back test failed yesterday with a double top 1697 ESU3 — which puts 1500 on the table into 2014 a bit stronger . // EMA(13) vs. EMA(34) http://scharts.co/17c4e9n .. Futures ESU3 trying to hold on to EMA(13) 1688
Did the market just get a lot weaker the last 24 hours??