
Last week’s analysis expected upwards movement from gold for the week. The hourly wave count was invalidated and price has moved lower, remaining above the invalidation point on the daily chart. Downwards movement is most likely a continuation of minor wave B.
Click on the charts below to enlarge.
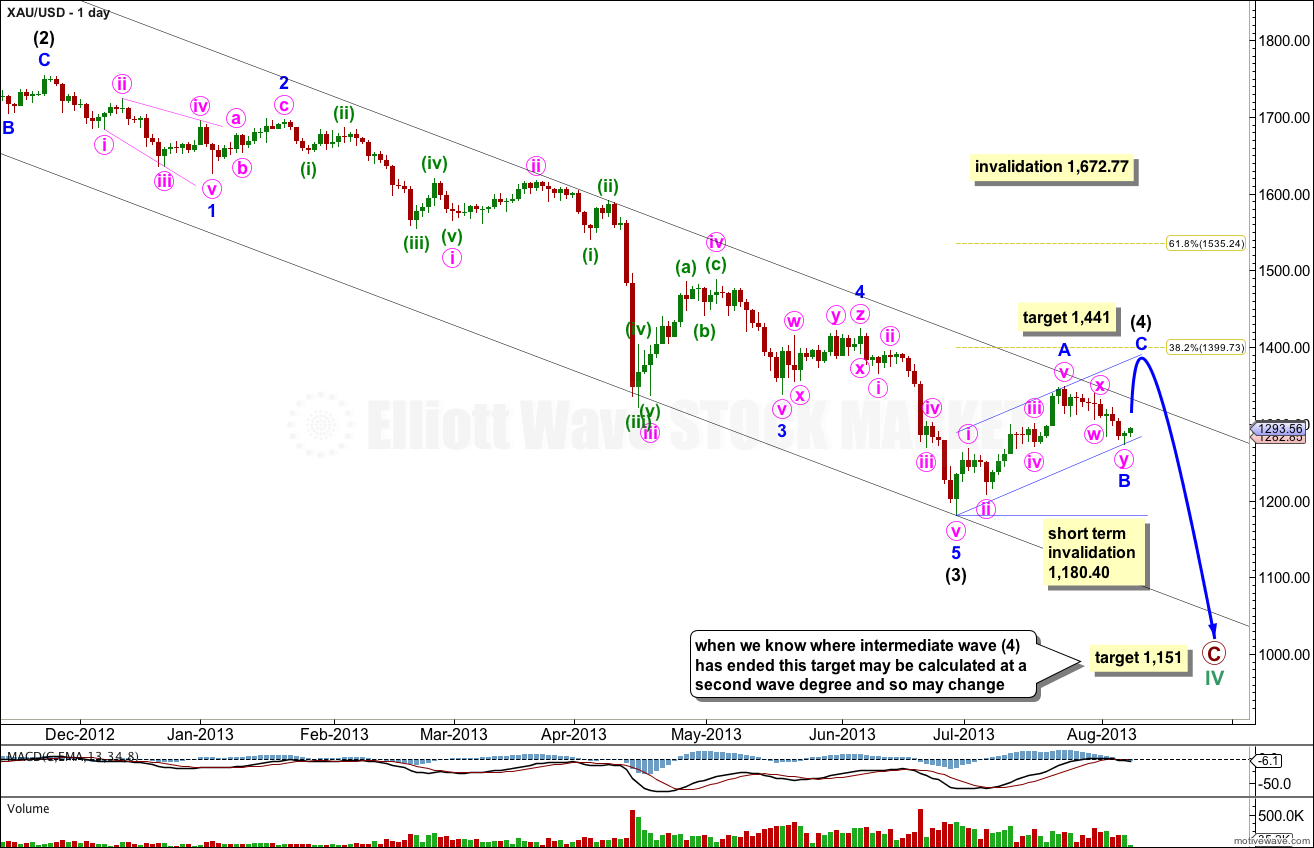
This daily chart focuses on the new downwards trend of primary wave C.
Within primary wave C intermediate waves (1) through to (3) are complete.
Intermediate wave (4) may last about four to six weeks, depending upon what structure it takes. So far it is just over four weeks. Intermediate wave (2) lasted three weeks and was a deep 66% zigzag.
Within intermediate wave (4) movement should be very choppy and overlapping. At this stage it looks like it may be unfolding as a zigzag because so far minor wave A subdivides as a completed five wave impulse.
At the high labeled minor wave A within intermediate wave (4) this movement looks strongly like a five wave impulse on the daily chart. If this is correct then intermediate wave (4) cannot be over here and must continue. I have tried to see if this can subdivide as a double zigzag. It can, just, but the wave count looks forced and must include a rare running flat.
At 1,441 minor wave C would reach equality in length with minor wave A. This target should be met in a bout a week or so. If minor wave B continues lower then this target must move correspondingly lower.
Within the zigzag minor wave B may not move beyond the start of minor wave A. This wave count is invalidated in the short term with movement below 1,180.40.
At 1,151 primary wave C would reach 0.618 the length of primary wave A. This target is a long term target. When we know where intermediate wave (4) has ended within primary wave C then we may use a second wave degree to also calculate this target, so it may widen to a zone or may change.
Within primary wave C intermediate wave (4) may not move into intermediate wave (1) price territory. This wave count is invalidated with movement above 1,672.77.
Main Hourly Wave Count.
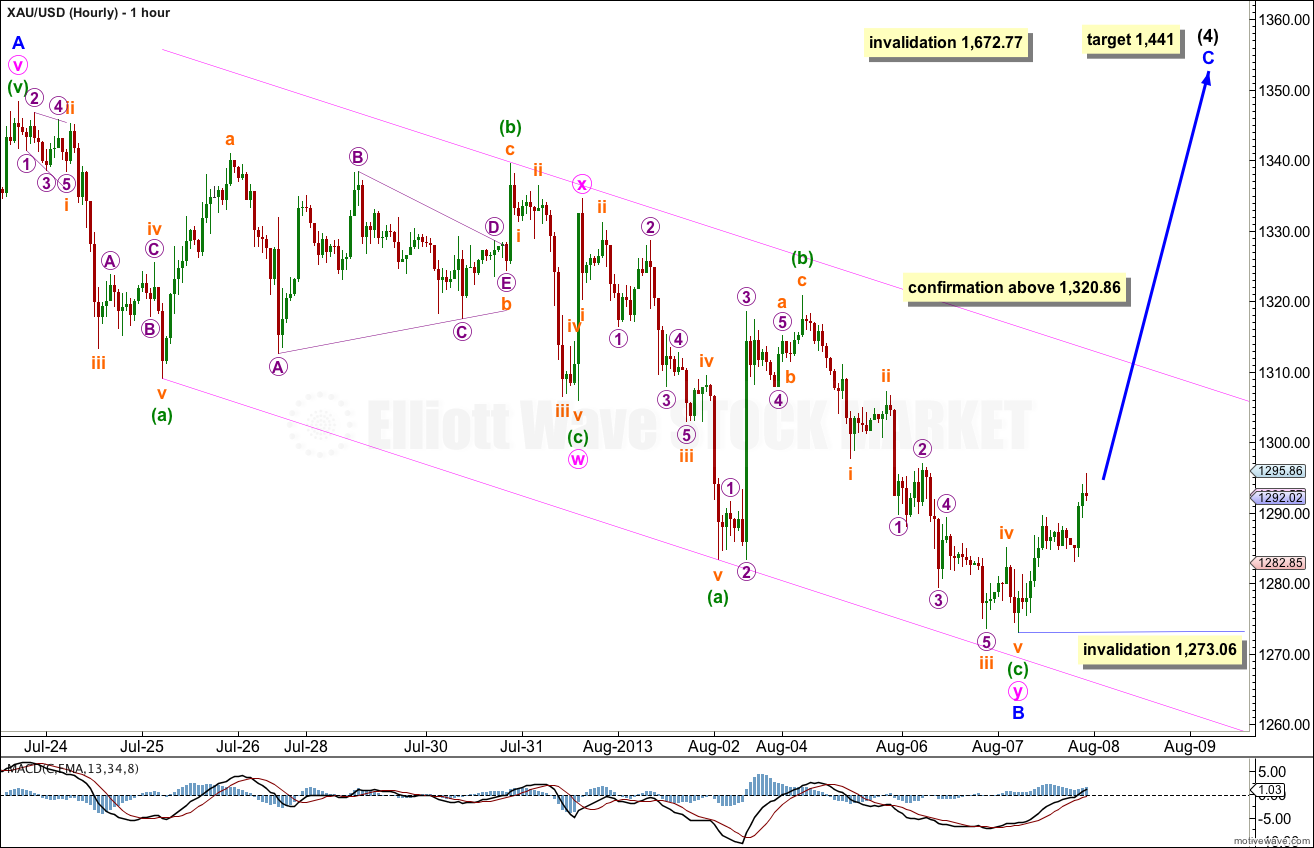
Minor wave B was not over last week. It continued further as a double zigzag. The subdivisions here within the first zigzag are the labeled the same as last week.
Within the second zigzag of the double labeled minute wave y minuette wave (c) is 3.43 short of equality with minuette wave (a).
I would have confidence in this wave count with price movement above 1,320.86. At that stage the alternate below would be invalidated.
Within minor wave C no second wave correction may move beyond the start of the first wave. This wave count is invalidated with movement below 1,273.06.
If this wave count is invalidated then the alternate below should be used.
Alternate Hourly Wave Count.
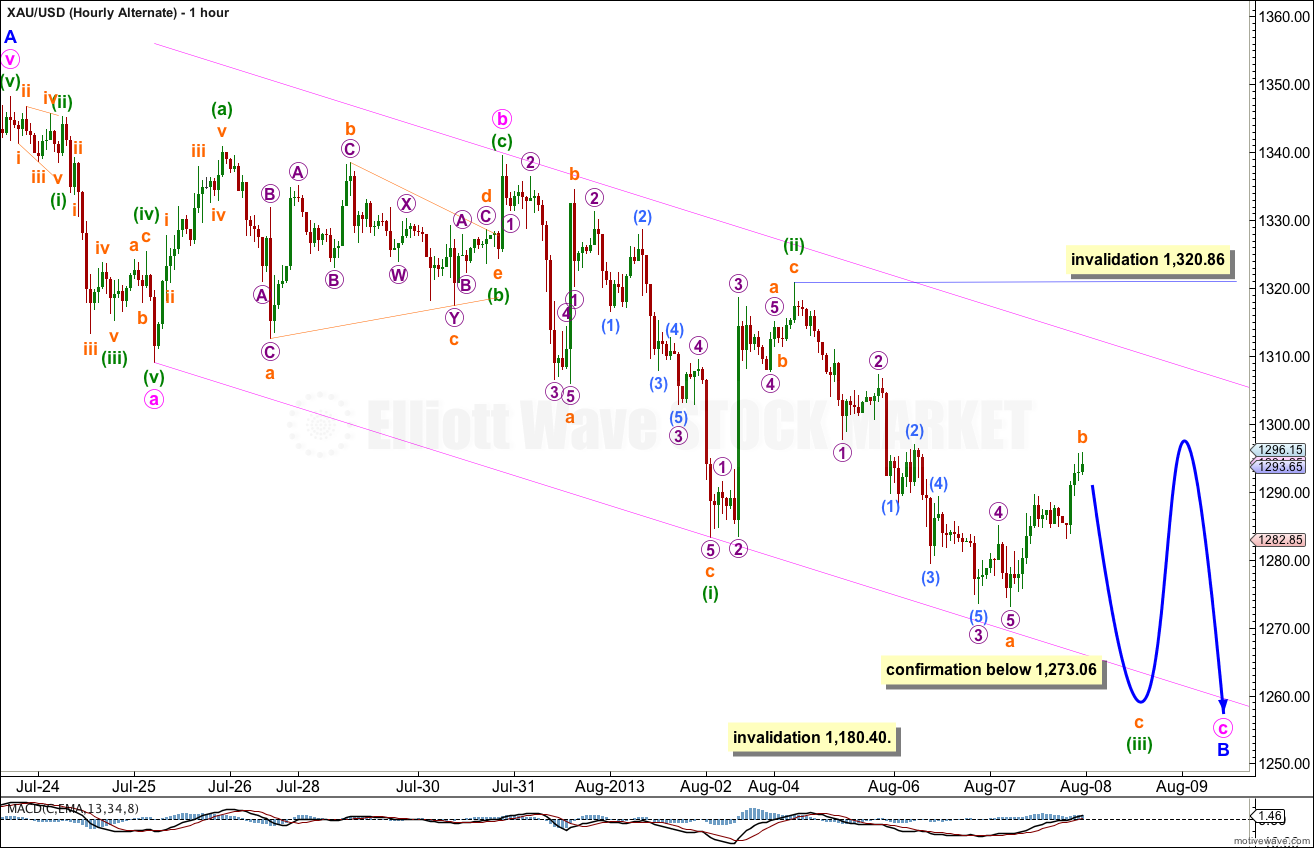
It is possible that minor wave B is an incomplete single zigzag if minute wave c within it is unfolding as an ending diagonal which is incomplete. The subdivisions are the same on both hourly wave counts up to this point.
Within the ending diagonal of minute wave c within minuette wave (iii) subminuette wave b may not move beyond the start of subminuette wave a. This wave count is invalidated with movement above 1,320.86.
This wave count would expect a few more days of downwards movement.