
Yesterday’s analysis had two hourly wave counts which diverged. The alternate expected some downwards movement and was confirmed below 1,703.55. However, the target of 1,700 was comfortably exceeded.
I have a new hourly wave count for you today.
Click on the charts below to enlarge.
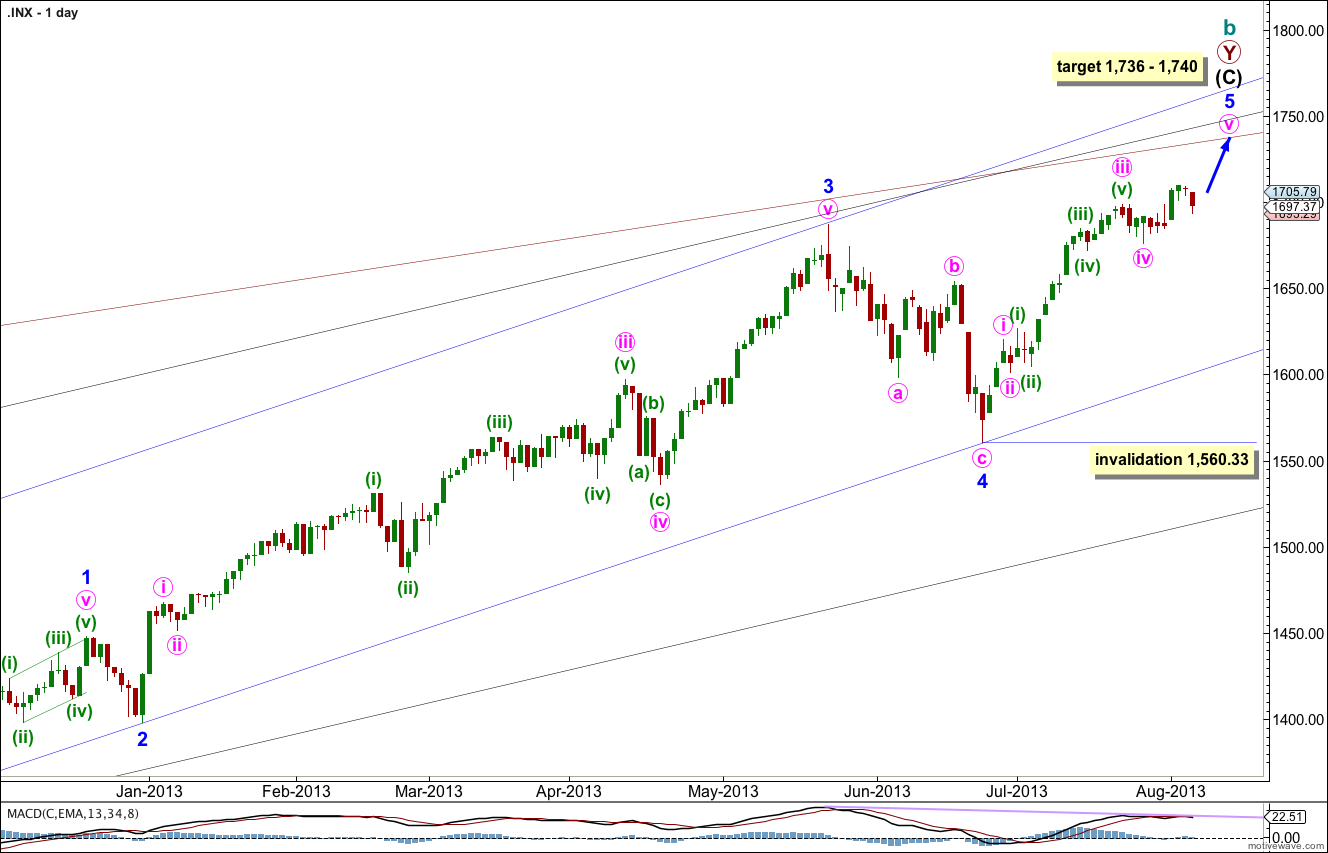
This wave count agrees with MACD and has some nice Fibonacci ratios in price and Fibonacci relationships in time.
Minor wave 3 is 15.1 points longer than 2.618 the length of minor wave 1.
Ratios within minor wave 3 are: there is no Fibonacci ratio between minute waves iii and i, and minute wave v is 5.44 points longer than equality with minute wave iii.
At 1,740 intermediate wave (C) would reach equality with intermediate wave (A). At 1,739 minor wave 5 would reach 0.618 the length of minor wave 3. At 1,736 minute wave v would reach 0.618 the length of minute wave iii.
Within minor wave 5 no second wave correction may move beyond the start of the first wave. This wave count is invalidated with movement below 1,560.33.
Minor wave 1 lasted a Fibonacci 21 days, minor wave 2 lasted a Fibonacci 8 days, minor wave 3 has no Fibonacci duration at 98 days, and minor wave 4 lasted 22 days, just one day longer than a Fibonacci 21.
At this stage minor wave 5 has lasted 30 sessions. A further four sessions would see it ending in a Fibonacci 34 (give or take one session either side of this would be an acceptable variation). At that time I will look to see if the structure could be considered complete. If it can we shall have an alternate wave count to consider the possibility again of a trend change at cycle degree.
Keep drawing the wider parallel channels from the monthly chart and copy them over to the daily chart.
Main Hourly Wave Count.
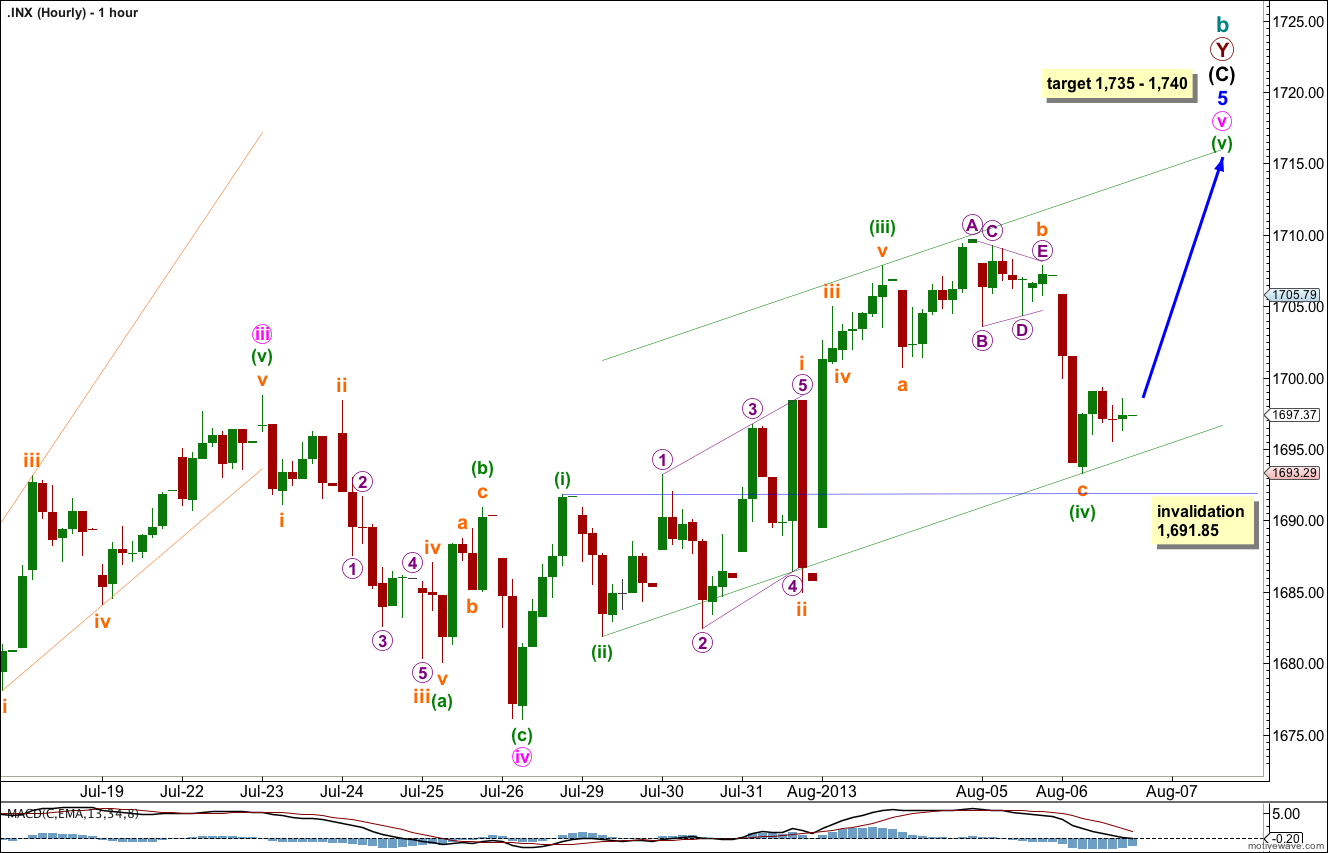
It is possible that minuette waves (i) through to (iv) are complete. This wave count still sees a leading diagonal at the beginning of minute wave v, but within minuette wave (iii) rather than the whole of minuette wave (i). This has a slighly better look and fit.
It is possible that the flat correction which likely completed during Tuesday’s session was minuette wave (iv).
With minuette wave (iii) ending at 1,707.85 it is just 0.39 points short of 1.618 the length of minuette wave (i). Minuette wave (iii) shows an increase in momentum, as shown on MACD, and for minuette wave (iv) momentum falls back to the zero line on MACD.
Ratios within minuette wave (iii) are: subminuette wave iii has no Fibonacci ratio to subminuette wave i, and subminuette wave v is 0.28 points longer than 0.382 the length of subminuette wave i.
Minuette wave (ii) is a brief zigzag and minuette wave (iv) shows nice alternation as a flat.
Minuette wave (i) was not extended, and minuette wave (iii) here is extended. Minuette wave (v) may extend, or not. It is less likely to exhibit a Fibonacci ratio to either of minuette waves (i) or (iii) because these two waves already exhibit such a close Fibonacci ratio.
At 1,735 minuette wave (v) would reach 1.618 the length of minuette wave (iii).
Minute wave v is not staying within the parallel channel drawn about minor wave 5. Draw a parallel channel about minute wave v using Elliott’s second technique. Draw the first trend line from the lows of minuette waves (ii) to (iv), then place a parallel copy upon the high of minuette wave (iii). Expect minuette wave (v) to end either midway within the channel or to find resistance at the upper edge.
If minuette wave (iv) moves lower it may not move into minuette wave (i) price territory. This wave count is invalidated with movement below 1,691.85.
Alternate Hourly Wave Count.
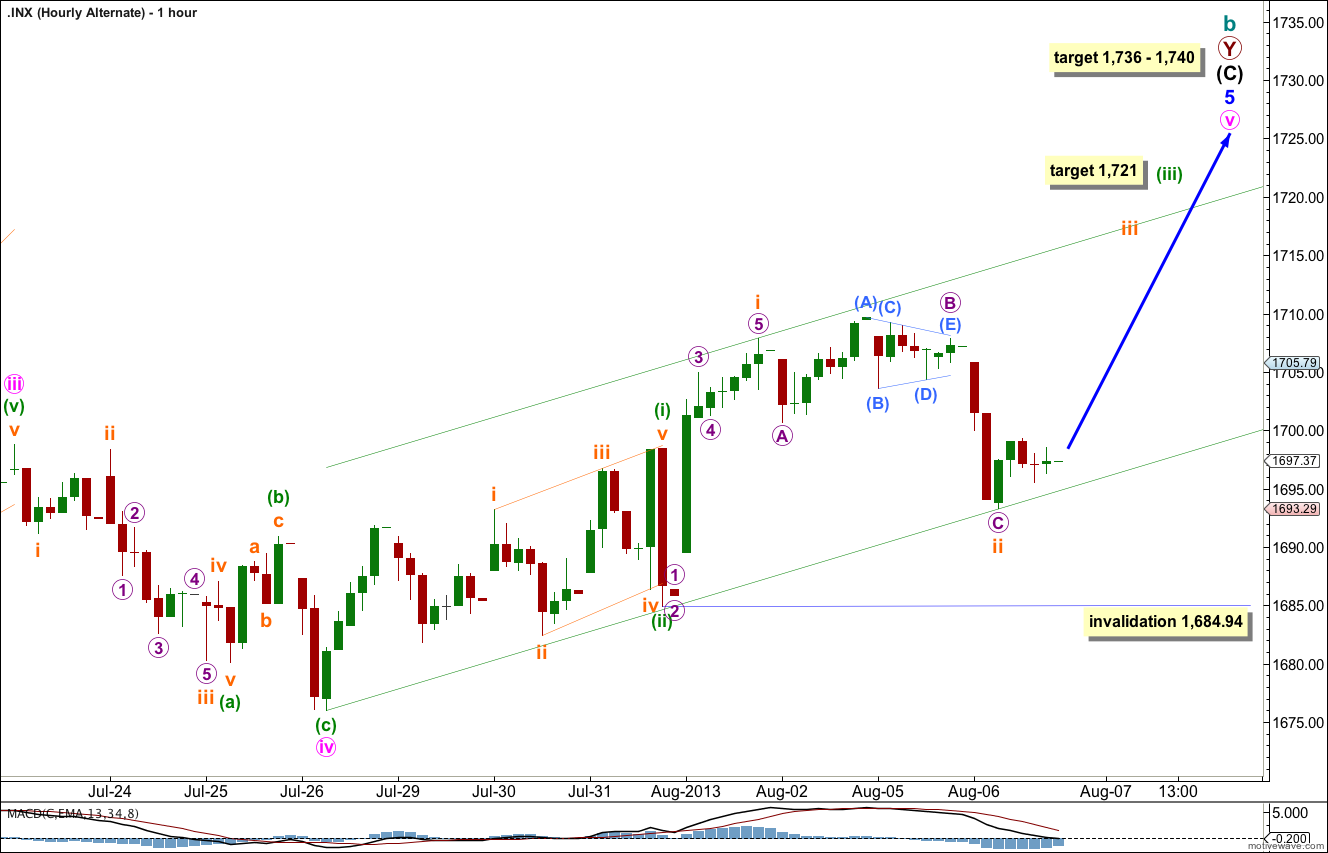
This alternate follows on directly from yesterday’s alternate. Overall it does not have as good a look as the main wave count because subminuette wave ii is much larger than minuette wave (ii), one degree higher.
This wave count also expects upwards movement tomorrow. The main difference is this alternate expects upwards movement to increase in momentum.
At 1,721 minuette wave (iii) would reach 1.618 the length of minuette wave (i).
The channel drawn here is a best fit. Draw the first trend line from the start of minute wave v to the low of subminuette wave ii. Place a parallel copy upon the high of subminuette wave i. Minute wave (iii) may overshoot the channel on the upper edge as momentum increases.
If subminuette wave ii moves any lower it may not move beyond the start of subminuette wave i. This wave count is invalidated with movement below 1,684.94.
…… great because I hit reverse at the lows (futures) 1680.50 yesterday 🙂
Looking for a blow off top after hours with the futures which does not have to include (cash) when we get to your upper target.
Still looking for the middle of Sep. for this last wave up ???
Nope, probably October now. That does seem to be a common time for a big trend change.
1709.67 Still not looking like a top … but it could be Wave 1 and now abc down for Wave 2
Yes. Exactly.