
Yesterday’s analysis expected upwards movement and a new high was made. Price has turned lower at the end of Wednesday’s session and remains well above the invalidation point on the hourly chart.
I have two hourly wave counts for you today with the same single daily wave count.
Click on the charts below to enlarge.
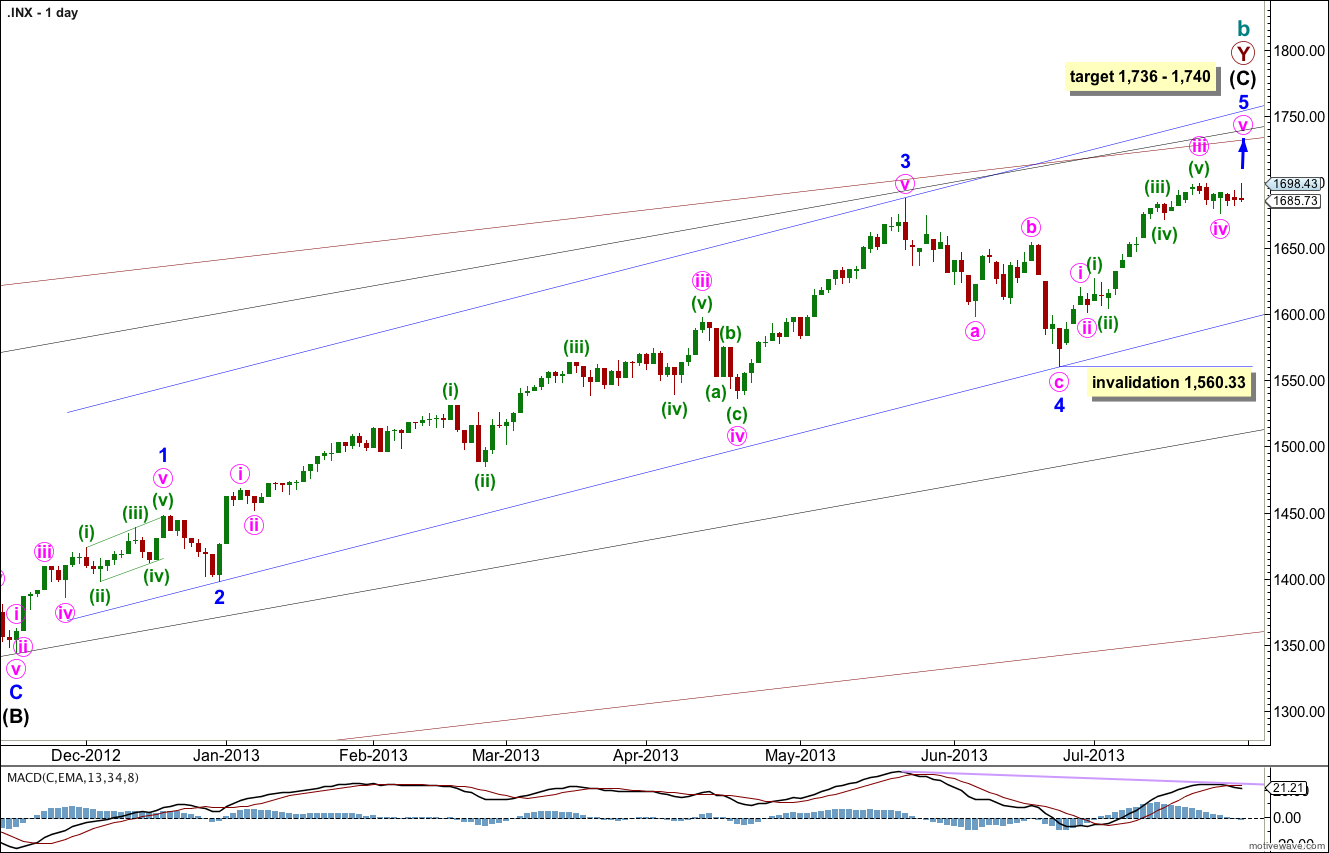
This wave count agrees with MACD and has some nice Fibonacci ratios in price and Fibonacci relationships in time.
Minor wave 3 is 15.1 points longer than 2.618 the length of minor wave 1.
Ratios within minor wave 3 are: there is no Fibonacci ratio between minute waves iii and i, and minute wave v is 5.44 points longer than equality with minute wave iii.
At 1,740 intermediate wave (C) would reach equality with intermediate wave (A). At 1,739 minor wave 5 would reach 0.618 the length of minor wave 3. At 1,736 minute wave v would reach 0.618 the length of minute wave iii.
Within minor wave 5 no second wave correction may move beyond the start of the first wave. This wave count is invalidated with movement below 1,560.33.
Minor wave 1 lasted a Fibonacci 21 days, minor wave 2 lasted a Fibonacci 8 days, minor wave 3 has no Fibonacci duration at 98 days, and minor wave 4 lasted 22 days, just one day longer than a Fibonacci 21.
At this stage minor wave 5 has lasted 26 sessions. A further eight sessions would see it ending in a Fibonacci 34. At that time I will look to see if the structure could be considered complete. If it can we shall have an alternate wave count to consider the possibility again of a trend change at cycle degree.
Keep drawing the wider parallel channels from the monthly chart and copy them over to the daily chart.
The main hourly wave count below follows on directly from yesterday’s analysis. The alternate looks at the possibility that minute wave iv is incomplete.
Main Hourly Wave Count.
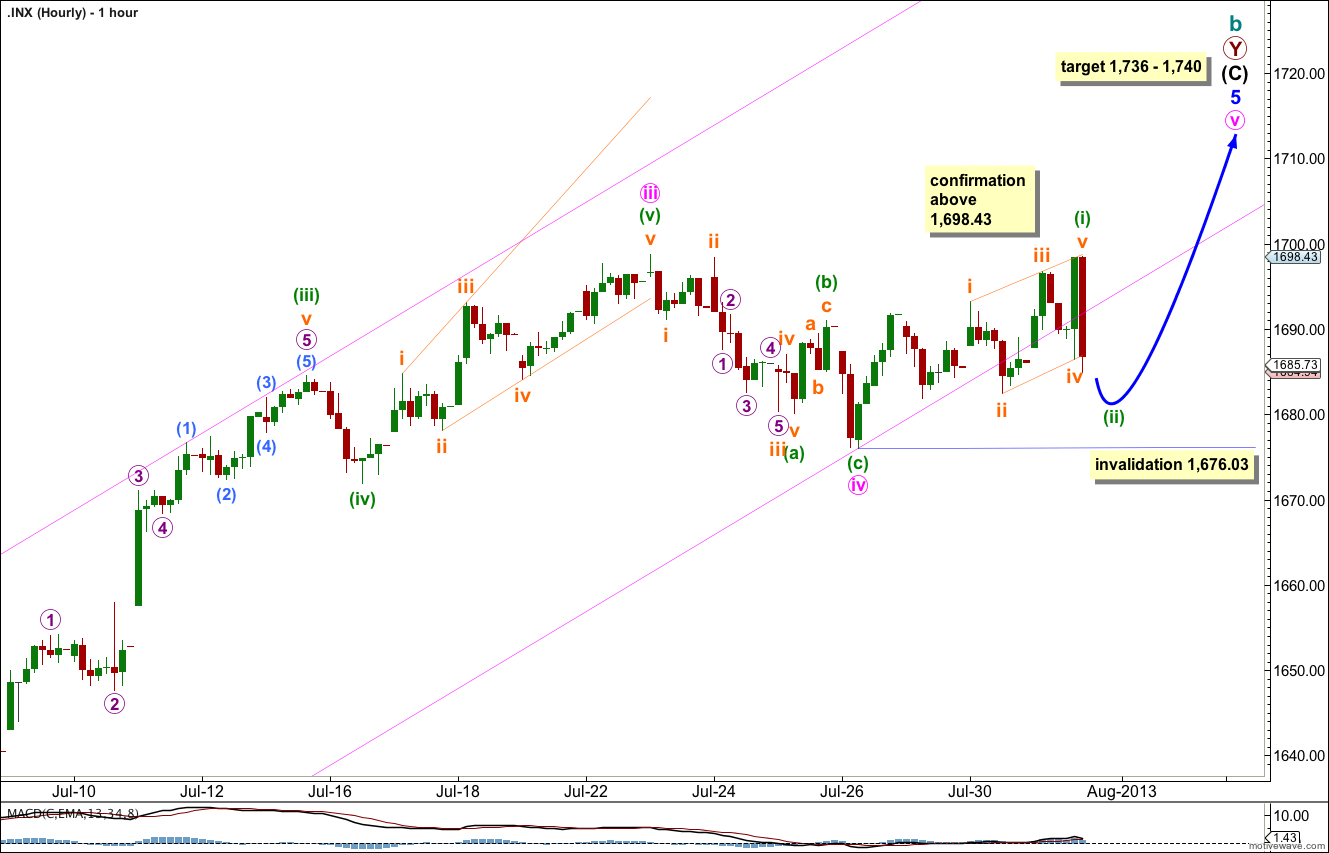
With all the overlapping upwards trending movement over the last few days we may have seen a leading diagonal unfold for minuette wave (i).
A leading diagonal in a first wave position is often followed by a deep second wave correction. On the five minute chart minuette wave (ii) looks like an incomplete structure. It is likely we shall see a little downwards movement tomorrow to complete minuette wave (ii).
When minuette wave (ii) is complete we should see an increase in upwards momentum as minuette wave (iii) unfolds. When minuette wave (ii) is complete then a target for minuette wave (iii) can be calculated (I cannot do that for you today). I would expect minuette wave (iii) to be about 36 points in length.
Movement above 1,698.43 would invalidate the alternate hourly wave count below and provide confirmation of this main wave count tomorrow.
Alternate Hourly Wave Count.
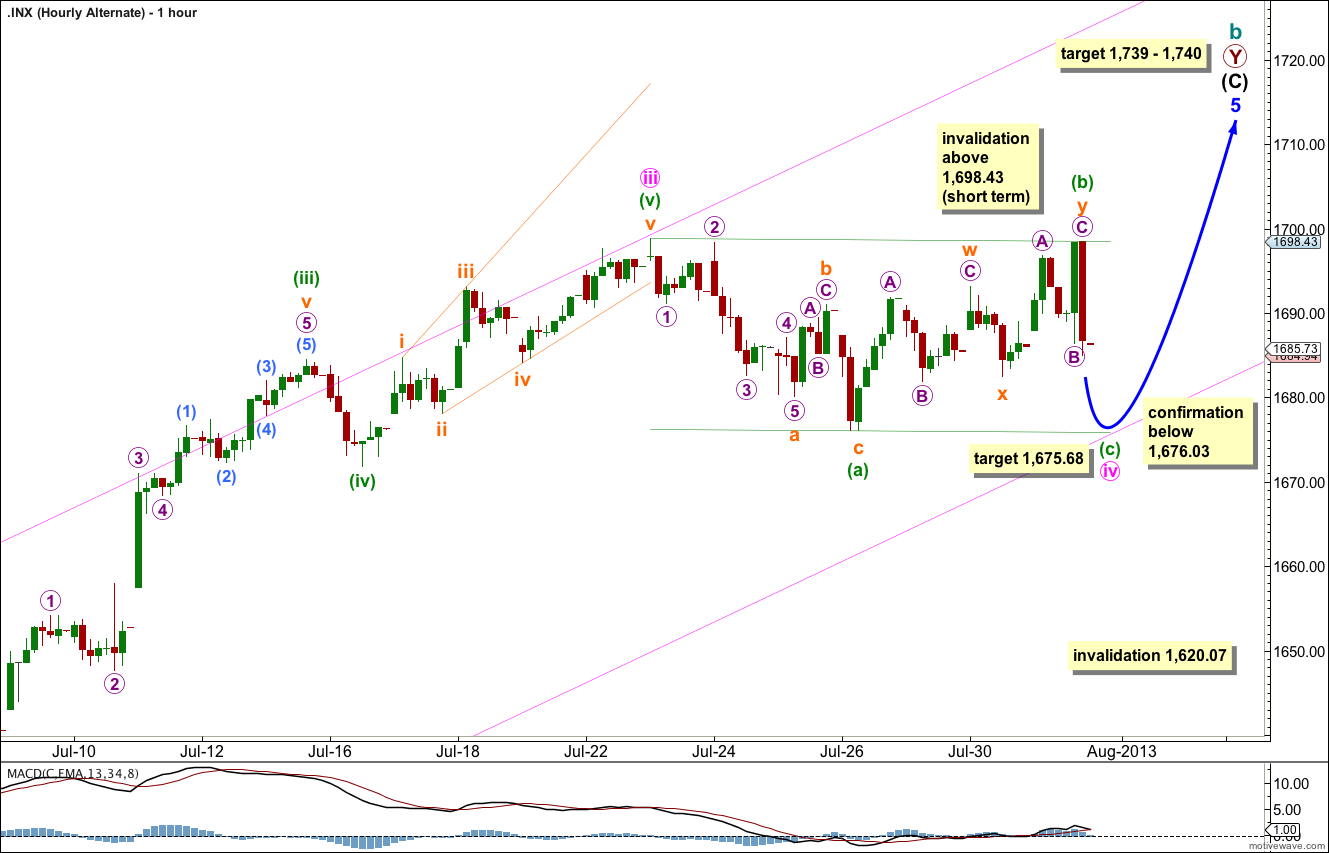
It is possible that minute wave iv is an incomplete regular flat correction.
Within the upwards movement labeled here as minuette wave (b) the subdivisions are the same as the main hourly wave count: 5-3-5-3-5-3-5. It is possible that this upwards movement is a double zigzag for minuette wave (b).
Minuette wave (b) is 98% the length of minuette wave (a) indicating that minute wave iv would be a regular flat correction. A regular flat expects minuette wave (c) to end very slightly below the end of minuette wave (a). At 1,675.68 minuette wave (c) would reach equality in length with minuette wave (a).
Draw a parallel channel about minute wave iv. For a regular flat minuette wave (c) should find support at the lower edge of the parallel channel.
If we see price move below 1,676.03, invalidating the main hourly wave count above, then I would not expect it to move much lower.
Minute wave iv may not move into minute wave i price territory. This wave count is invalidated with movement below 1,620.07.
Lara 36 points from yesterday’s close? You think that will be the length of Wave III? Sure didn’t correct this morning so that’s what I am thinking.
Best video and analysis yet Lara! Nice job thank you!!!
You’re welcome!