
Upwards movement over the last week does not fit with the wave count I was using. I have spent some time looking for alternates and I will change the wave count to better fit with the changing situation for AAPL.
Click on the charts below to enlarge.
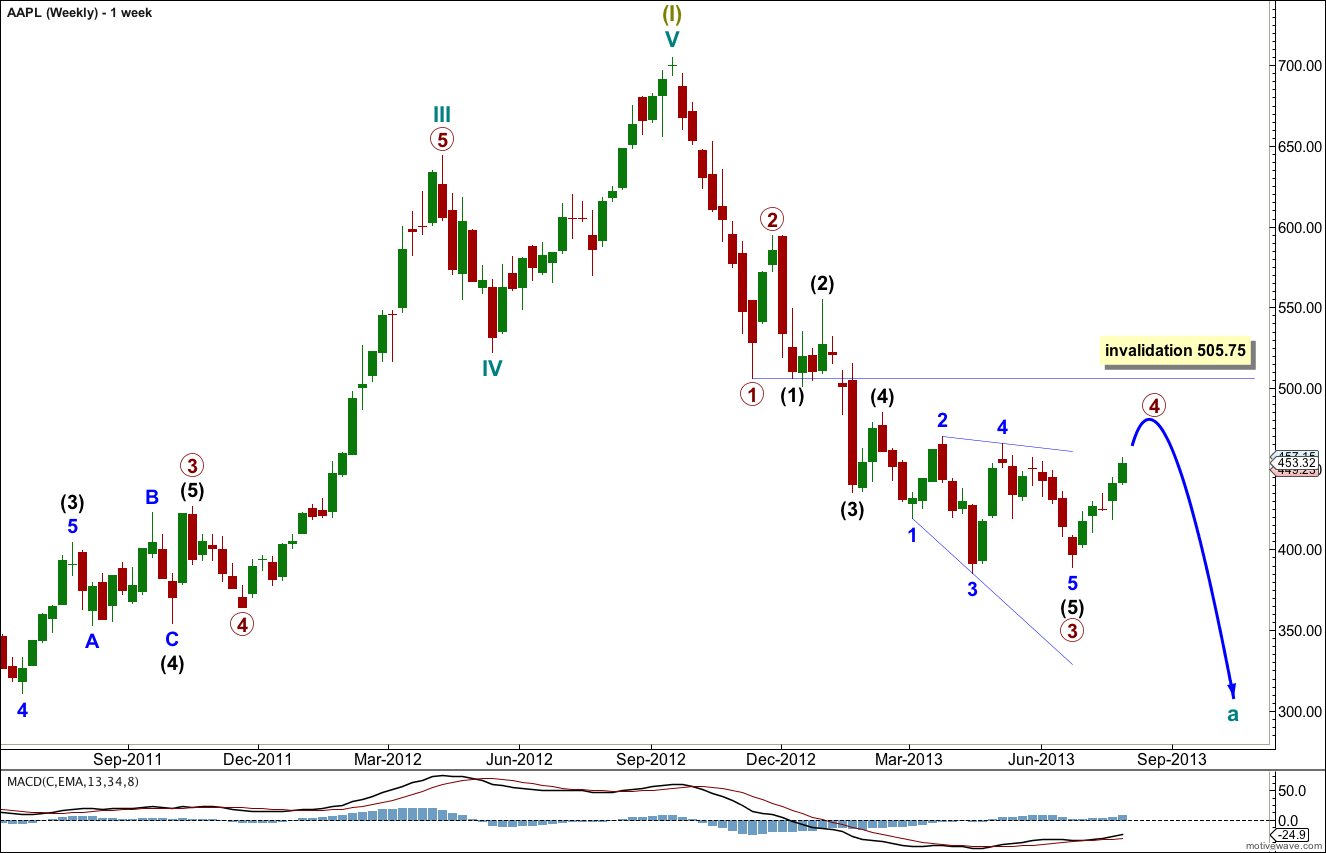
On the weekly chart there is an increase in momentum from the end of primary wave 1 at November 2012, to primary wave 3. This indicates that primary wave 3 may be over. Upwards movement of the last two weeks or so may be primary wave 4.
Primary wave 4 may not move into primary wave 1 price territory. This wave count is invalidated with movement above 505.75.
Primary wave 3 may have ended recently with an ending diagonal for intermediate wave (5) which had a truncated fifth wave.
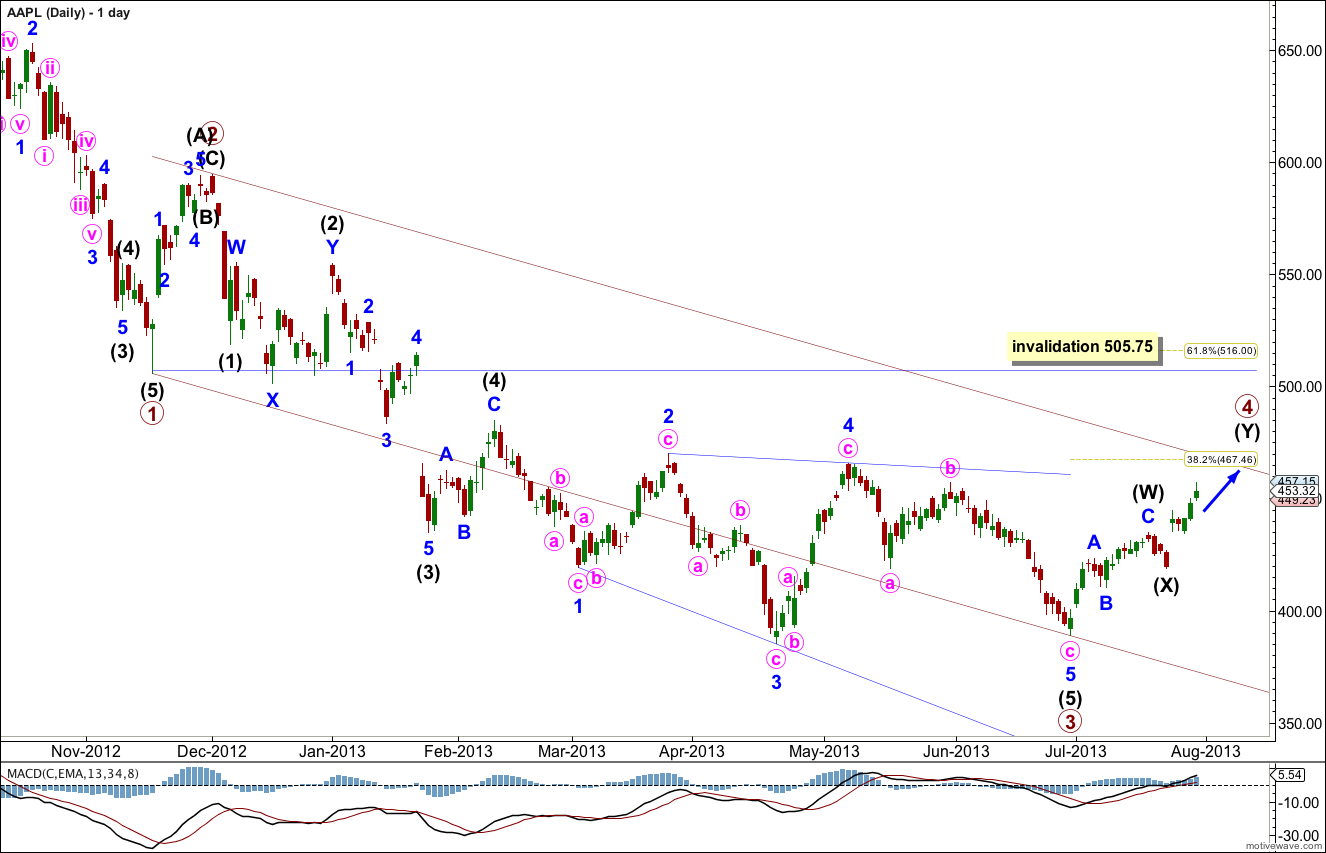
At the daily chart level there is no increase in momentum within primary wave 3 beyond primary wave 1. I will rely upon this being seen at a higher time frame.
Primary wave 3 is just 6.40 longer than equality with primary wave 1.
Ratios within primary wave 3 are: intermediate wave (3) is 2.9 short of 1.618 the length of intermediate wave (1), and intermediate wave (5) has no Fibonacci ratio to either of intermediate waves (1) or (3).
Primary wave 4 may be unfolding as a double zigzag structure. The first zigzag in the double, intermediate wave (W) is completed. The double is joined by a zigzag in the opposite direction labeled intermediate wave (X). The second zigzag in the double intermediate wave (Y) is incomplete.
Primary wave 4 may end about the 0.382 Fibonacci ratio of primary wave 3 at 467.46.
Primary wave 2 was a brief sharp shallow 44% single zigzag. Primary wave 4 may show alternation in depth and / or structure. So far it is showing alternation in structure.
Primary wave 4 may not move into primary wave 1 price territory. This wave count is invalidated with movement above 505.75.

Within primary wave 4 the second zigzag in the double may be underway.
Within intermediate wave (W) there is no Fibonacci ratio between minor waves A and C.
Within intermediate wave (X) minor wave C is 0.52 longer than equality with minor wave A.
At 476 minor wave C within intermediate wave (Y) would reach 1.618 the length of minor wave A.
Within minor wave C minute wave ii may not move beyond the start of minute wave i. This wave count is invalidated with movement below 434.34.
Alternate Daily Wave Count.
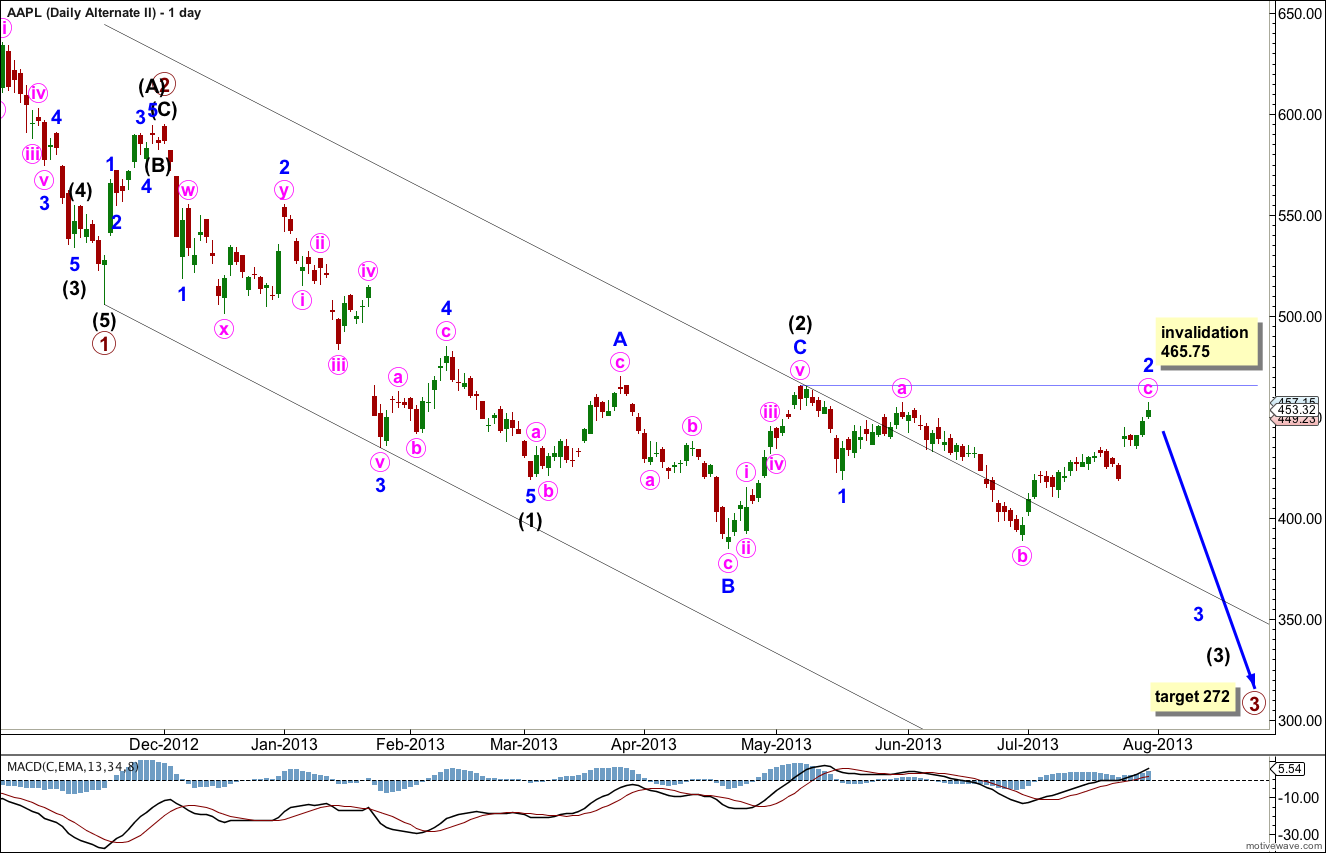
While price remains below 465.75 it remains possible that primary wave 3 is not over and is extending. Within it intermediate waves (1) and (2) may be complete and intermediate wave (3) may be beginning as a long extension.
Within intermediate wave (3) minor wave 1 may be complete and minor wave 2 may be an almost complete expanded flat correction.
Minor wave 2 is now out of proportion to intermediate waves (1) and (2) giving this wave count an odd look and reducing its probability.
Only if price remains below 465.75 and turns downwards with a strong increase in momentum would I now consider this wave count to be correct. At this stage it now is an outlying possibility only.
Minor wave 2 may not move beyond the start of minor wave 1. This wave count is invalidated with movement above 465.75.