
Last analysis expected a continuation of upwards movement to begin on Monday. Price has moved lower but remains well above the invalidation point on the hourly chart.
The wave count remains the same with just the one daily and one hourly chart today.
Click on the charts below to enlarge.
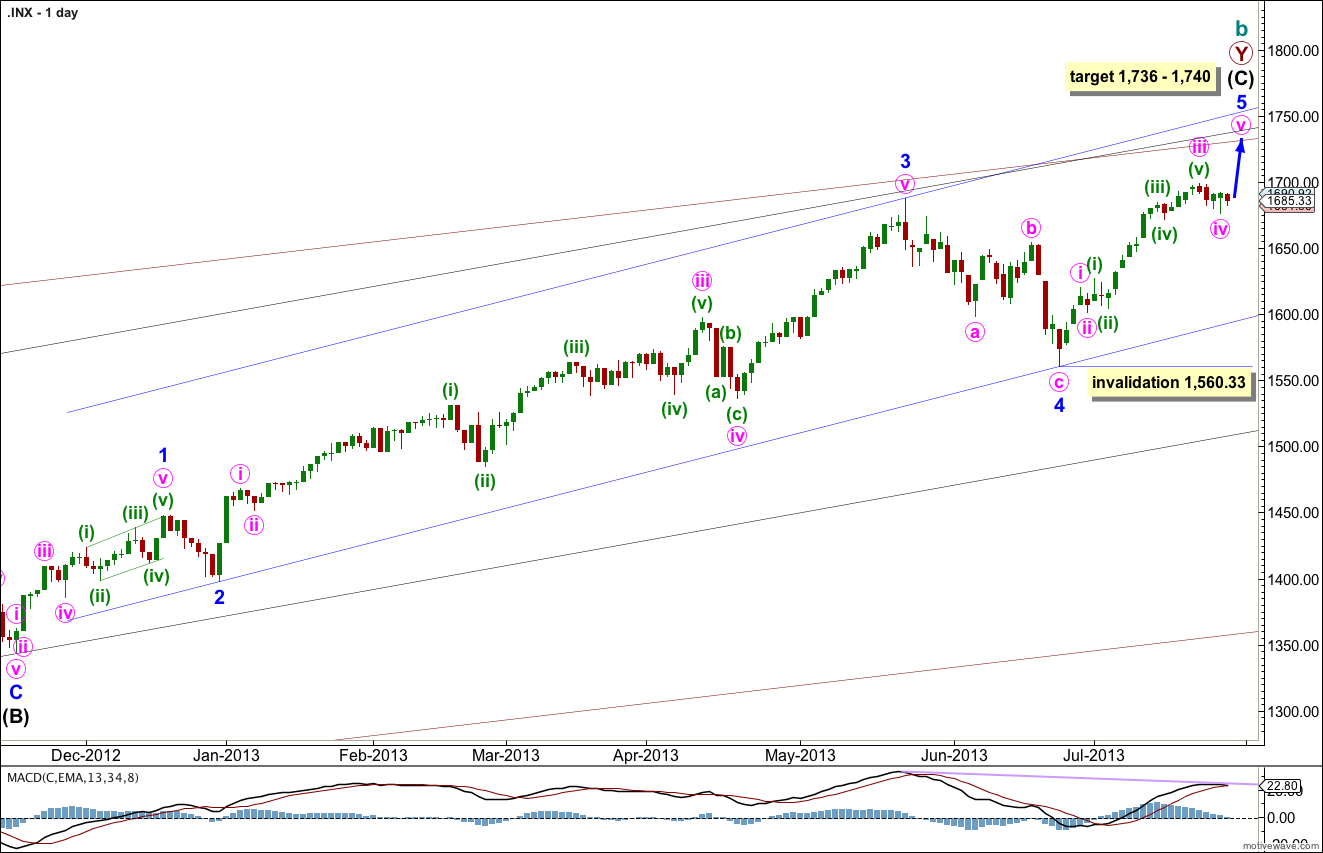
This wave count agrees with MACD and has some nice Fibonacci ratios in price and Fibonacci relationships in time.
Minor wave 3 is 15.1 points longer than 2.618 the length of minor wave 1.
Ratios within minor wave 3 are: there is no Fibonacci ratio between minute waves iii and i, and minute wave v is 5.44 points longer than equality with minute wave iii.
At 1,740 intermediate wave (C) would reach equality with intermediate wave (A). At 1,739 minor wave 5 would reach 0.618 the length of minor wave 3. At 1,736 minute wave v would reach 0.618 the length of minute wave iii.
Within minor wave 5 no second wave correction may move beyond the start of the first wave. This wave count is invalidated with movement below 1,560.33.
Minor wave 1 lasted a Fibonacci 21 days, minor wave 2 lasted a Fibonacci 8 days, minor wave 3 has no Fibonacci duration at 98 days, and minor wave 4 lasted 22 days, just one day longer than a Fibonacci 21.
At this stage minor wave 5 has lasted 24 sessions. A further 10 sessions would see it ending in a Fibonacci 34. At that time I will look to see if the structure could be considered complete. If it can we shall have an alternate wave count to consider the possibility again of a trend change at cycle degree.
Keep drawing the wider parallel channels from the monthly chart and copy them over to the daily chart.
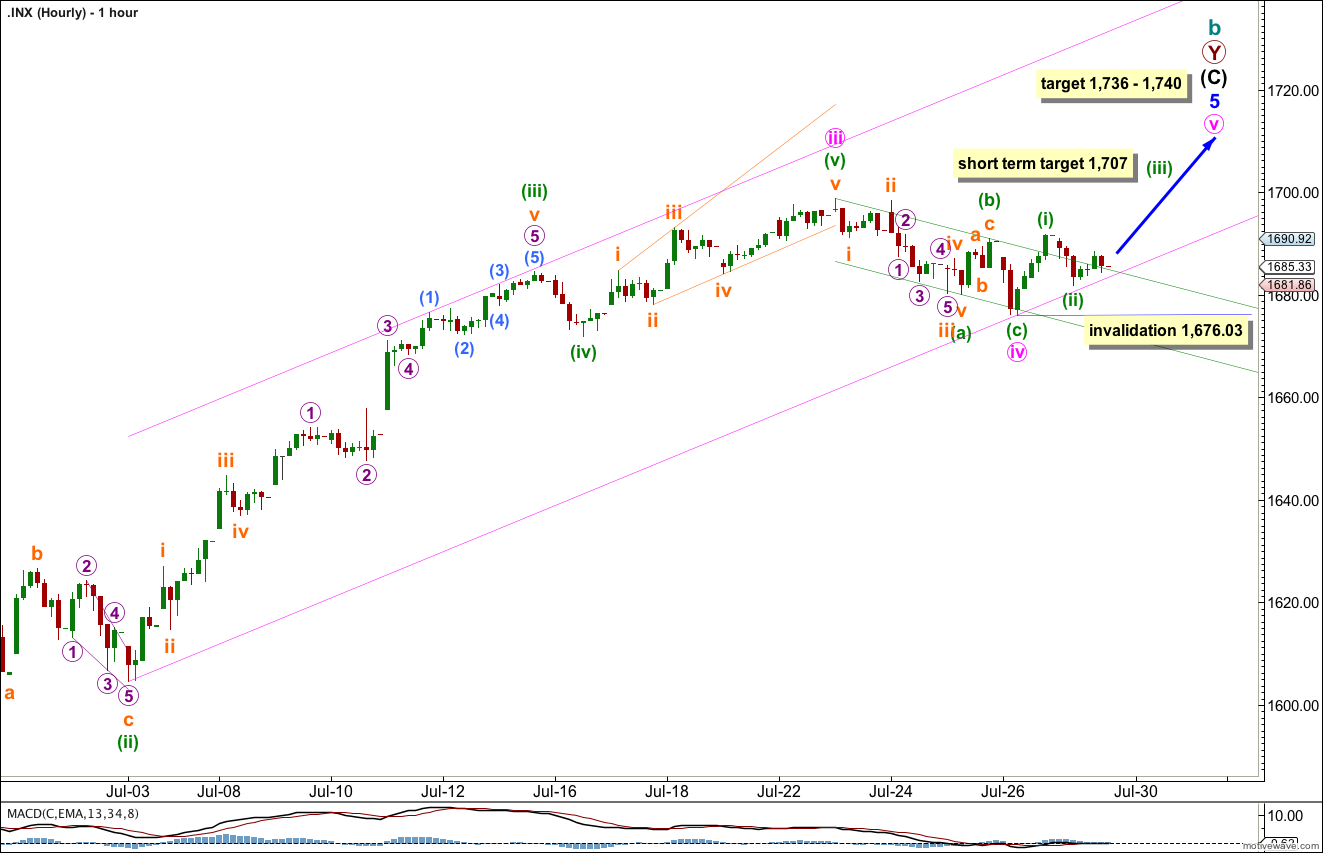
Downwards movement for Monday’s session may have been a small second wave correction within minute wave v.
If minute wave (iii) begins here at 1,681.86 then it would reach 1.618 the length of minute wave (i) at 1,707. This target may be reached this week.
I have redrawn the parallel channel about minor wave 5 today. Draw the first trend line from the lows of minute wave (ii) within minute wave iii, to minute wave iv. Place a parallel copy upon the highs within minuette wave (iii) of minute wave iii to contain all this movement. The lower trend line appears to be sitting just below a line of support. It may continue to do so.
Within minute wave v minuette wave (ii) may not move beyond the start of minuette wave (i). This wave count is invalidated with movement below 1,676.03.
If this wave count is invalidated with movement below 1,676.03 then it is possible that minute wave iv is continuing further as a double, flat or triangle. This is possible but it has a very low probability. If it were to occur then we may be seeing a lower degree fractal of minor waves 4 and 2 on the daily chart. The invalidation point for this idea is at the end of minute wave i at 1,620.07.
Nice job Lara thanks