
Movement above 1,687.18 has invalidated the main wave count and confirmed the alternate. We now have just the one wave count.
As price moves closer to the target I will use a third wave degree to add another target calculation.
Click on the charts below to enlarge.
Main Monthly Wave Count.
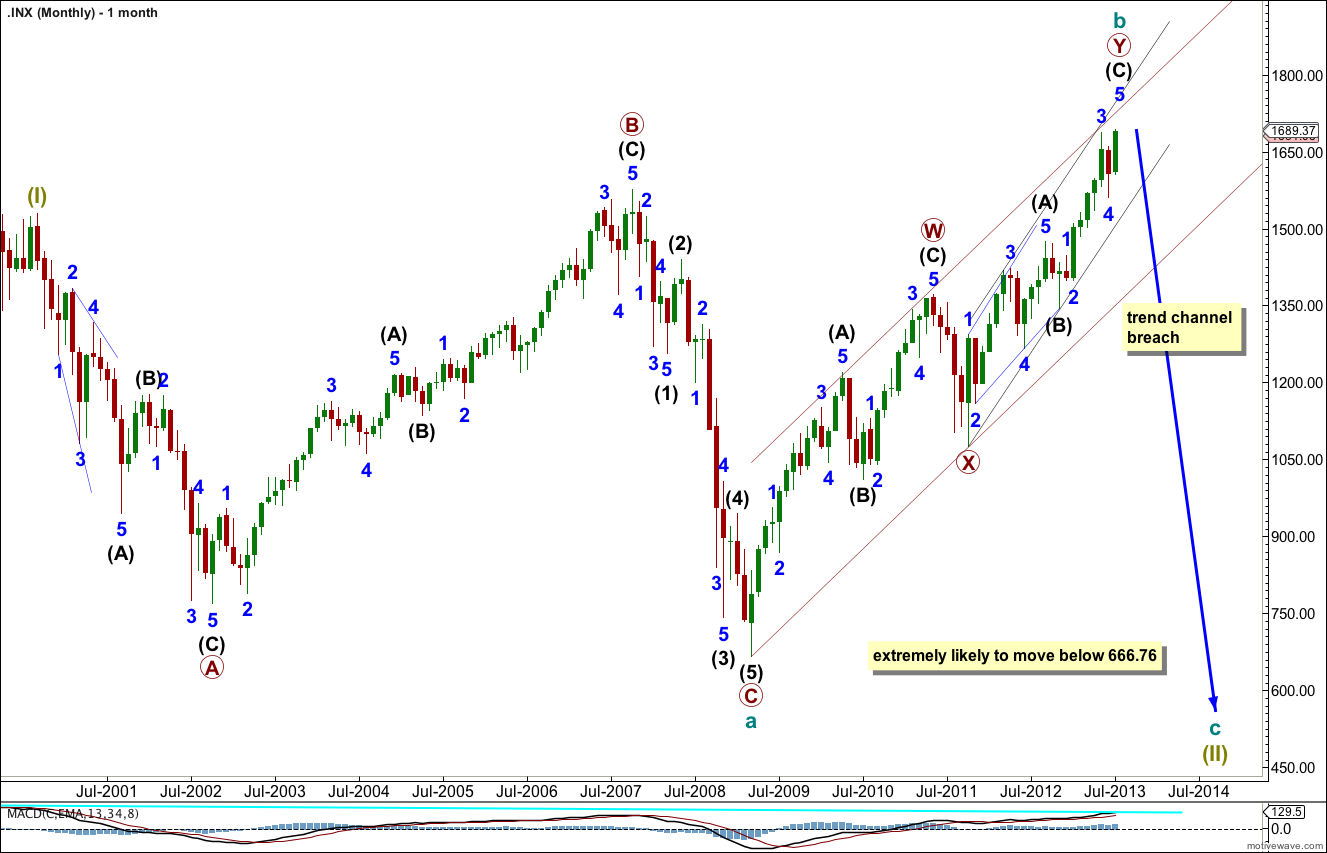
Cycle wave b may be nearing its end. Price may again find resistance at the upper edge of the parallel channel drawn here about the entirety of cycle wave b.
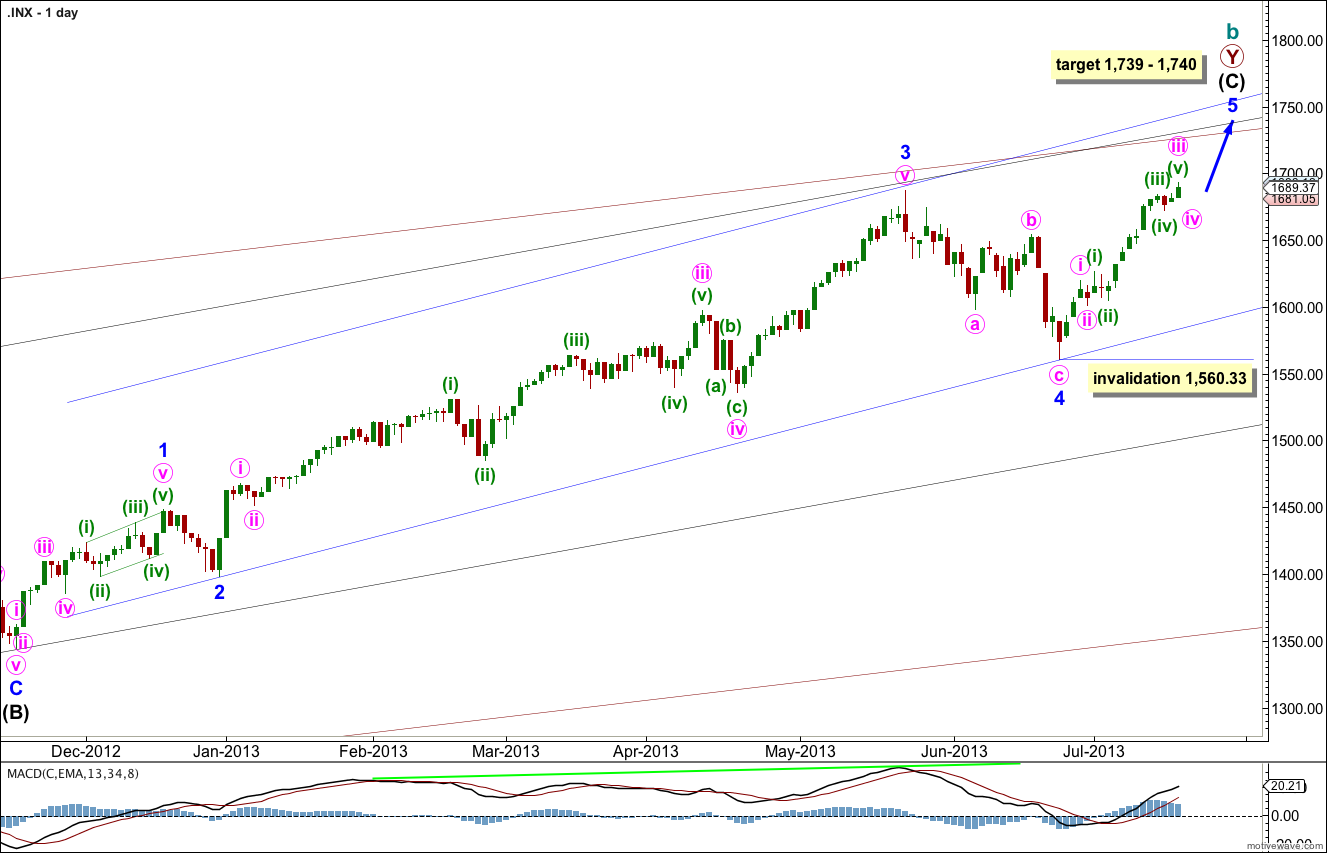
Movement above 1,687.18 has confirmed this wave count and it must be correct, despite the disproportionate look of minor wave 4.
I have adjusted this wave count to agree with how it looks on the monthly and weekly charts. I have checked subdivisions of minor wave 1 on the hourly chart and placed labels accordingly here on the daily chart. Within minor wave 1 minute wave ii was a short brief zigzag and minute wave iv a larger zigzag, a smaller fractal of the relationship between minor waves 2 and 4.
This wave count agrees with MACD and has some nice Fibonacci ratios in price and Fibonacci relationships in time.
Minor wave 3 is 15.1 points longer than 2.618 the length of minor wave 1.
Ratios within minor wave 3 are: there is no Fibonacci ratio between minute waves iii and i, and minute wave v is 5.44 points longer than equality with minute wave iii.
At 1,740 intermediate wave (C) would reach equality with intermediate wave (A). At 1,739 minor wave 5 would reach 0.618 the length of minor wave 3.
Within minor wave 5 no second wave correction may move beyond the start of the first wave. This wave count is invalidated with movement below 1,560.33.
Minor wave 1 lasted a Fibonacci 21 days, minor wave 2 lasted a Fibonacci 8 days, minor wave 3 has no Fibonacci duration at 98 days, and minor wave 4 lasted 22 days, just one day longer than a Fibonacci 21.
At this stage minor wave 5 has lasted 17 days. In another four days it would have lasted a Fibonacci 21. A further 13 days beyond that would see it ending in a Fibonacci 34. At each of these dates I will look to see if the structure could be considered complete. If it can we shall have an alternate wave count to consider the possibility again of a trend change at cycle degree.
Keep drawing the wider parallel channels from the monthly chart and copy them
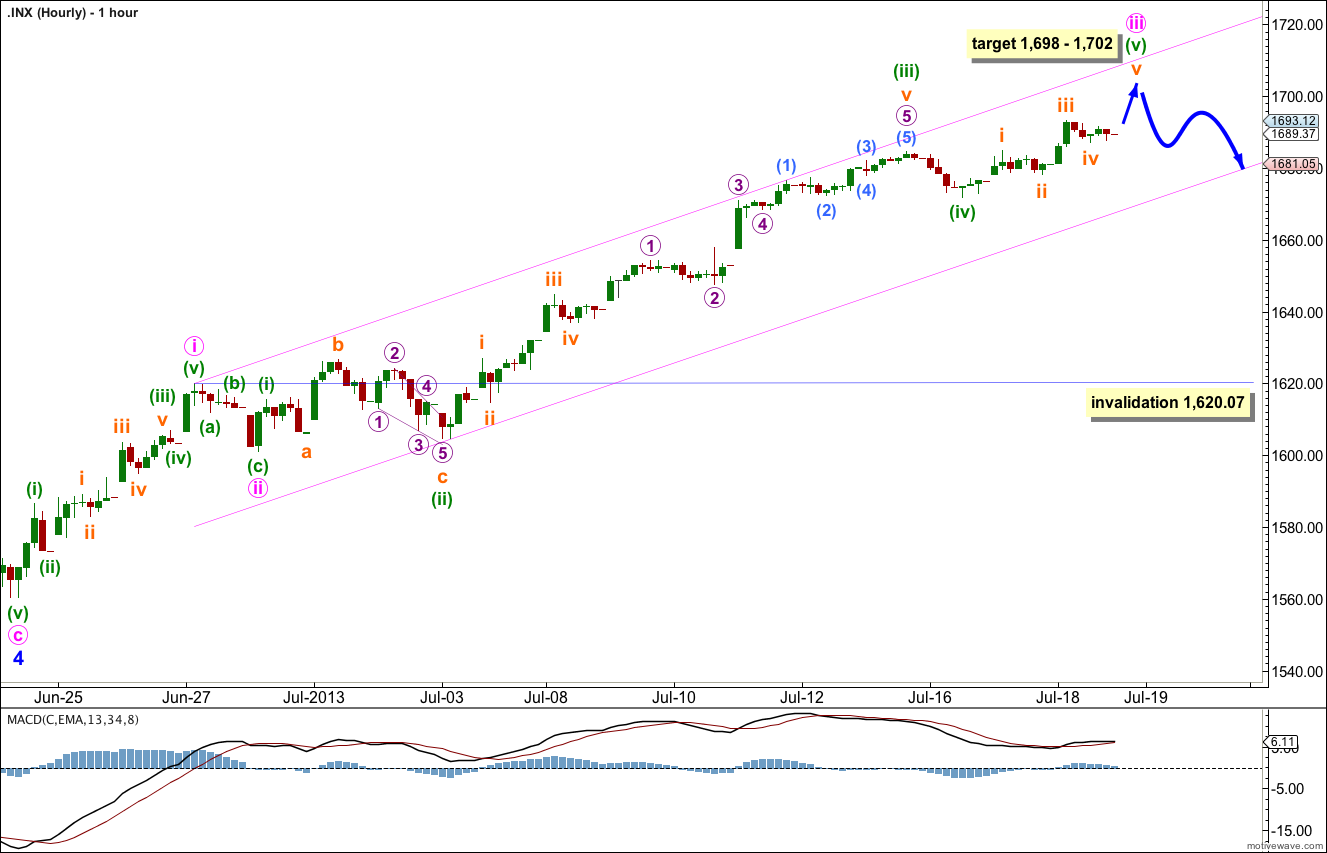
I am adjusting the wave count at the hourly chart level today to have a better fit with MACD and to avoid the rare running flat in yesterday’s hourly wave count.
The biggest problem with this hourly wave count is minuette wave (ii) within minute wave iii. It is out of proportion to minute wave ii. This is less of a problem though than seeing a running flat for minute wave ii.
There is no Fibonacci ratio between minuette waves (i) and (iii). I would expect to see a Fibonacci ratio between minuette wave (v) and either of (i) or (iii). At 1,702 minute wave (v) would reach 0.382 the length of minute wave (iii).
At 1,698 minute wave iii would reach 1.618 the length of minute wave i.
At 1,700 subminuette wave v would reach equality with subminuette wave i.
This gives us a seven point target zone calculated at three wave degrees. I favour the upper edge of the zone because it is calculated at lower wave degrees.
When minute wave iii is complete we should expect choppy overlapping movement for minute wave iv for a couple of days or so. Minute wave iv may find support about the lower edge of this best fit parallel channel.
Minute wave iv may not move into minute wave i price territory. This wave count is invalidated with movement below 1,620.07.
When minute wave v is complete we will again be faced with the possibility of a large trend change at cycle degree. At that stage I will move the labeling of the whole of minor wave 5 all down one degree and look at the possibility that only minute wave i would be complete. Such an alternate would have its invalidation point at 1,560.33. This will continue to be an important price point for us.
Would a push over 1705.5 take any ending diagonal off the table ??
No.
An ending diagonal is all about structure, not length.