
Sideways movement in a very small range for Wednesday’s session has failed to break above 1,687.18. Both wave counts remain valid and very little changed. They both have an even probability.
Click on the charts below to enlarge.
Main Wave Count.
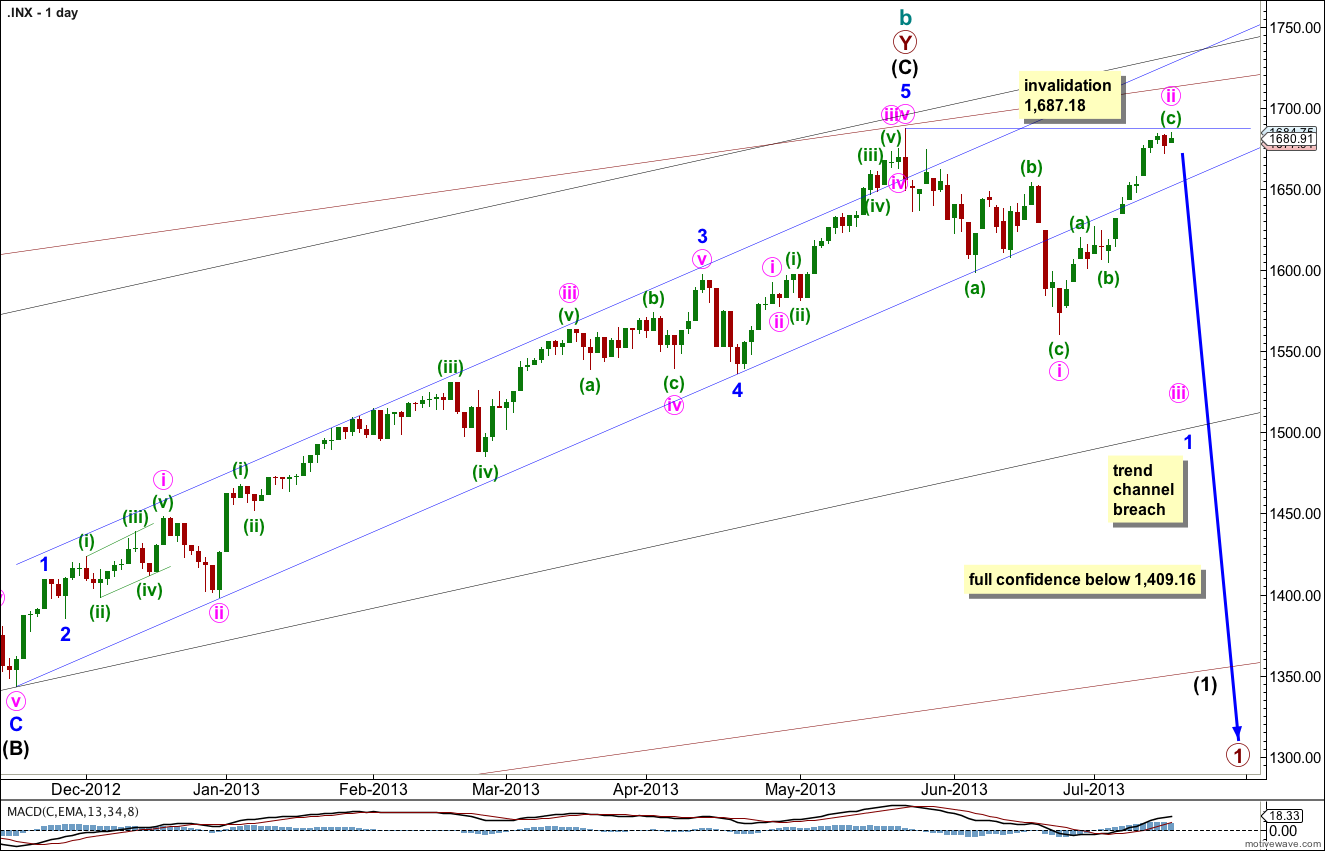
The widest maroon channel is copied over from the monthly chart and contains all of cycle wave b. It may be that price found final resistance at the upper edge of this channel.
The black channel in the middle is drawn about the zigzag of primary wave Y. Draw the first trend line from the start of primary wave Y to the end of intermediate wave (B). Place a parallel copy upon the extreme within intermediate wave (A). The upper edge of this channel also may be where price found resistance and where intermediate wave (C) ended.
The smallest blue channel is the most conservative best fit I can see for intermediate wave (C). It is very clearly breached by downwards movement.
What would give me confidence in this trend change is a clear breach of the black intermediate degree channel. When that is breached I will calculate long term downwards targets for you.
There is no classic technical divergence between price and MACD on the daily or weekly charts. This is possible, but unusual for the S&P 500. This must reduce the probability of this wave count.
There are no Fibonacci ratios between minor waves 1, 3 and 5 within intermediate wave (C). There is no Fibonacci ratio between intermediate waves (A) and (C). This lack of Fibonacci ratios slightly reduces the probability of this main wave count.
Minor wave 1 must be unfolding as a leading diagonal. Within the diagonal minute wave i is complete. Minute wave ii is now also probably complete although the channel about it on the hourly chart has not been clearly breached.
Minute wave ii may not move beyond the start of minute wave i. This wave count is invalidated with movement above 1,687.18.
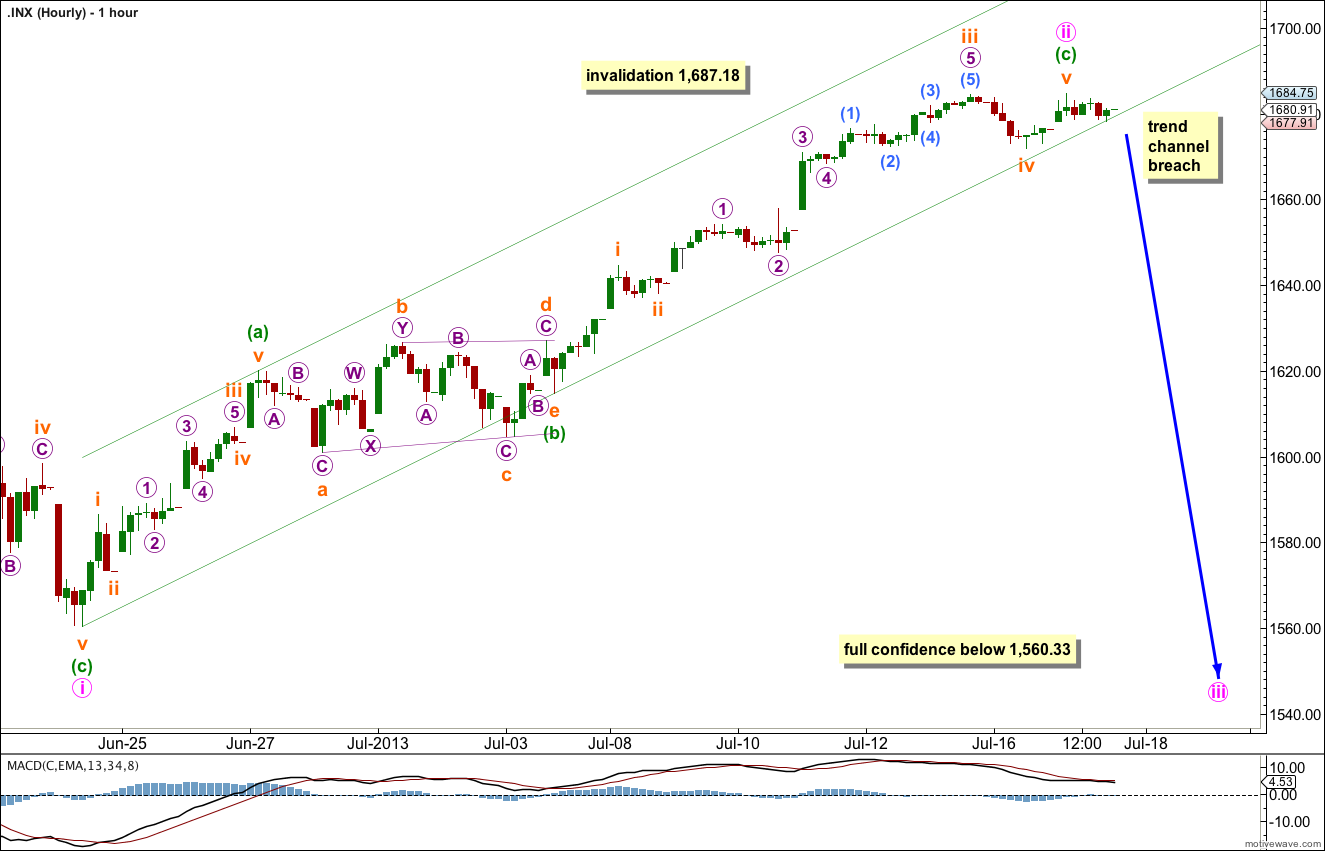
A very slight new high was made which means minute wave ii continued a little higher during Wednesday’s session.
There is still no Fibonacci ratio between minuette waves (a) and (c).
Ratios within minuette wave (c) are: subminuette wave iii is 2.04 points short of 1.618 the length of subminuette wave i, and subminuette wave v has no Fibonacci ratio to either of subminuette waves i or iii.
Importantly, on the five minute chart the upwards movement labeled subminuette wave v subdivides neatly into a five wave impulse. It is difficult to see this as a three.
Unfortunately price remains within the small channel drawn here using Elliott’s technique about the zigzag of minute wave ii. We do not yet have any confirmation of a trend change, in the short nor mid term. We need to see a full hourly candlestick fully below this channel and not touching the lower trend line to have trend channel confirmation that minute wave ii is over and minute wave iii downwards has begun. We may get this tomorrow.
Minute wave iii is most likely to subdivide into a zigzag (because it is within a diagonal) but may also subdivide into an impulse. It must move below the end of minute wave i. Movement below 1,560.33 would provide full confidence in this wave count at both the hourly and daily chart levels.
If minute wave ii moves any higher it may not move beyond the start of minute wave i. This wave count is invalidated with movement above 1,687.18.
Alternate Wave Count.
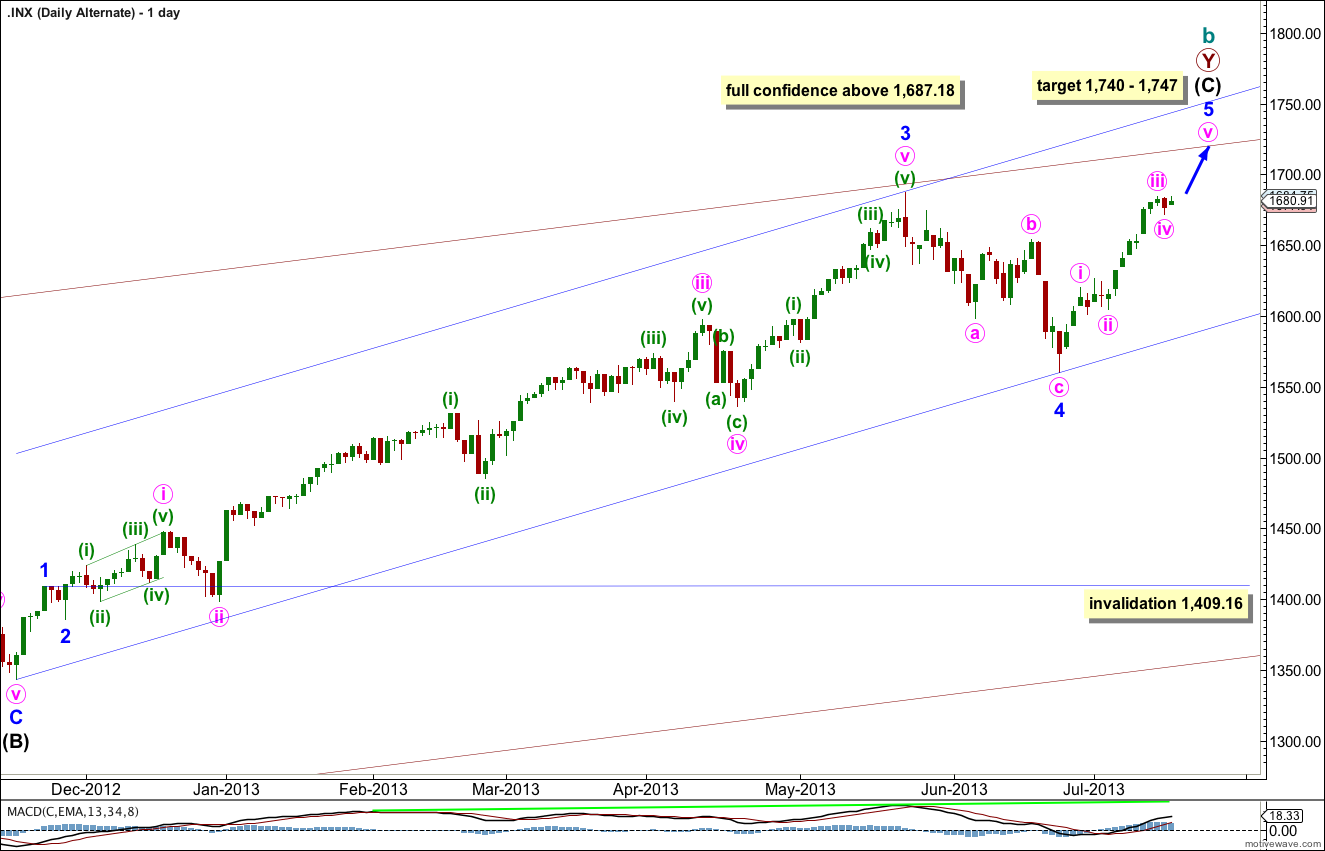
Minor wave 4 is out of proportion to all the other corrections within intermediate wave (C) reducing the probability of this wave count and giving it an odd look.
Within intermediate wave (C) minor wave 3 is 23 points longer than 4.236 the length of minor wave 1.
The lack of classic technical divergence between price and MACD supports this wave count. A final fifth wave up with slowing momentum would provide divergence and give a typical look in terms of momentum. So far within minor wave 5 minute waves i, ii and now also iii may be complete.
At 1,740 intermediate wave (C) would reach equality with intermediate wave (A). At 1,747 minor wave 5 would reach 0.618 the length of minor wave 3.
Minor wave 4 may not move into minor wave 1 price territory. This wave count is invalidated with movement below 1,409.16. However, if a new low below 1,560.33 were to occur this wave count would look so strange and wrong it would be discarded.
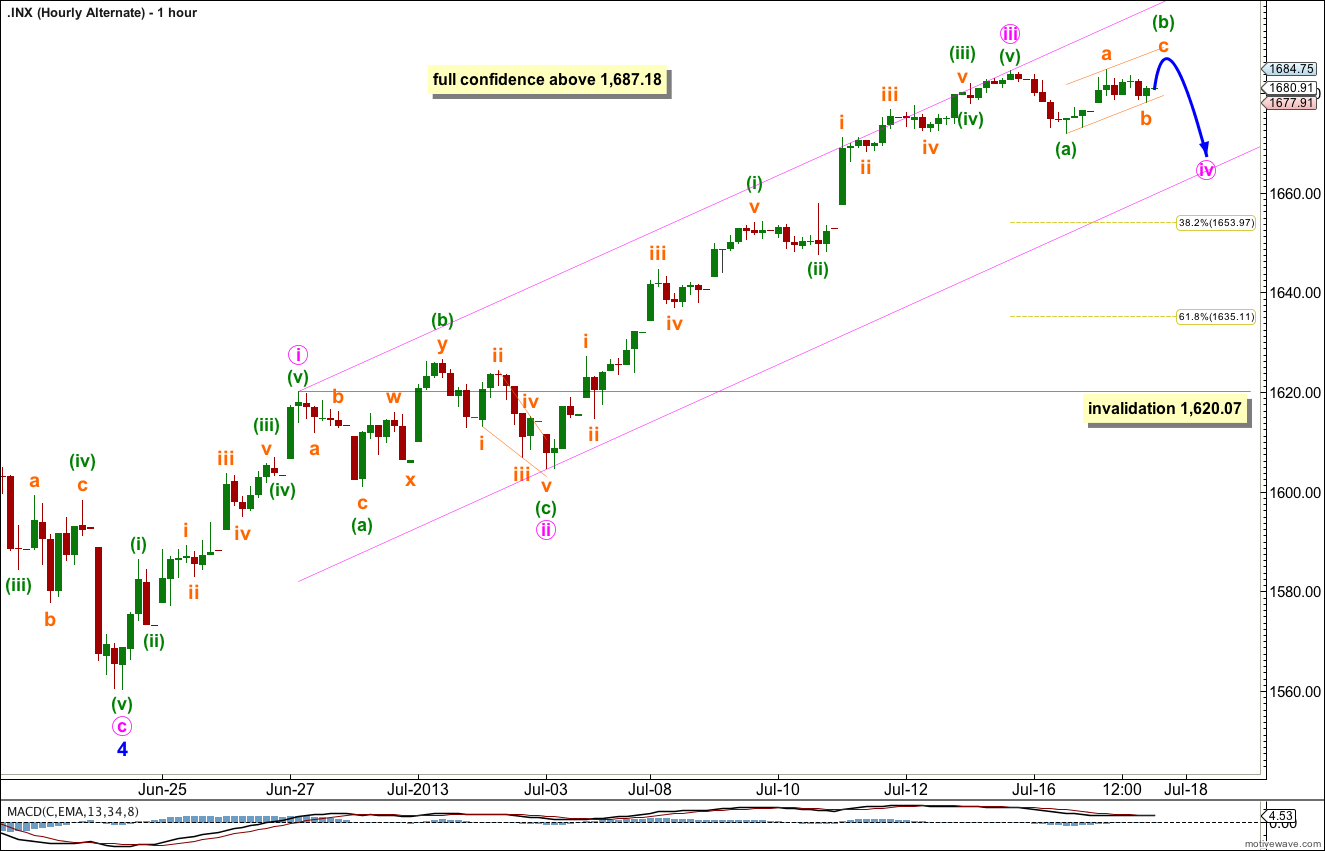
Minute wave iv may be unfolding as a flat correction.
Within this flat correction minuette wave (b) may be incomplete. Subminuette wave a subdivides nicely as a five wave impulse on the five minute chart. Subminuette wave c may make a new high.
The most common type of flat is an expanded flat which would require minuette wave (b) to reach 105% the length of minuette wave (a) at 1,685.14. Movement to this price point or above is very likely for this wave count tomorrow.
When minuette wave (b) is a completed three wave structure then minuette wave (c) should move price below the end of minuette wave (a) at 1,671.84 to avoid a truncation and a rare running flat.
It is also possible that minute wave iv may be continuing as a triangle.
Minute wave iv may not move into minute wave i price territory. This wave count is invalidated with movement below 1,620.07.
If price moves below 1,620.07 this week then there is one other structural possibility for minor wave 5, an ending diagonal. An ending diagonal requires all subwaves to subdivide into zigzags. Downwards movement may be a zigzag for minute wave ii which may not move beyond the start of minute wave i. The invalidation point for this structure would be at 1,560.33.
Only movement below 1,560.33 would invalidate this wave count fully at the hourly chart level.
Lara,
We finally have some clarity. But I am wondering if we are still in pink wave iii, with this being the final wave up within pink iii. It does not matter much, as I assume we are looking for another wave down and then the final wave up.
Peter