
Price has moved slightly higher on very low volume and with a decrease in momentum.
Click on the charts below to enlarge.
Main Wave Count.
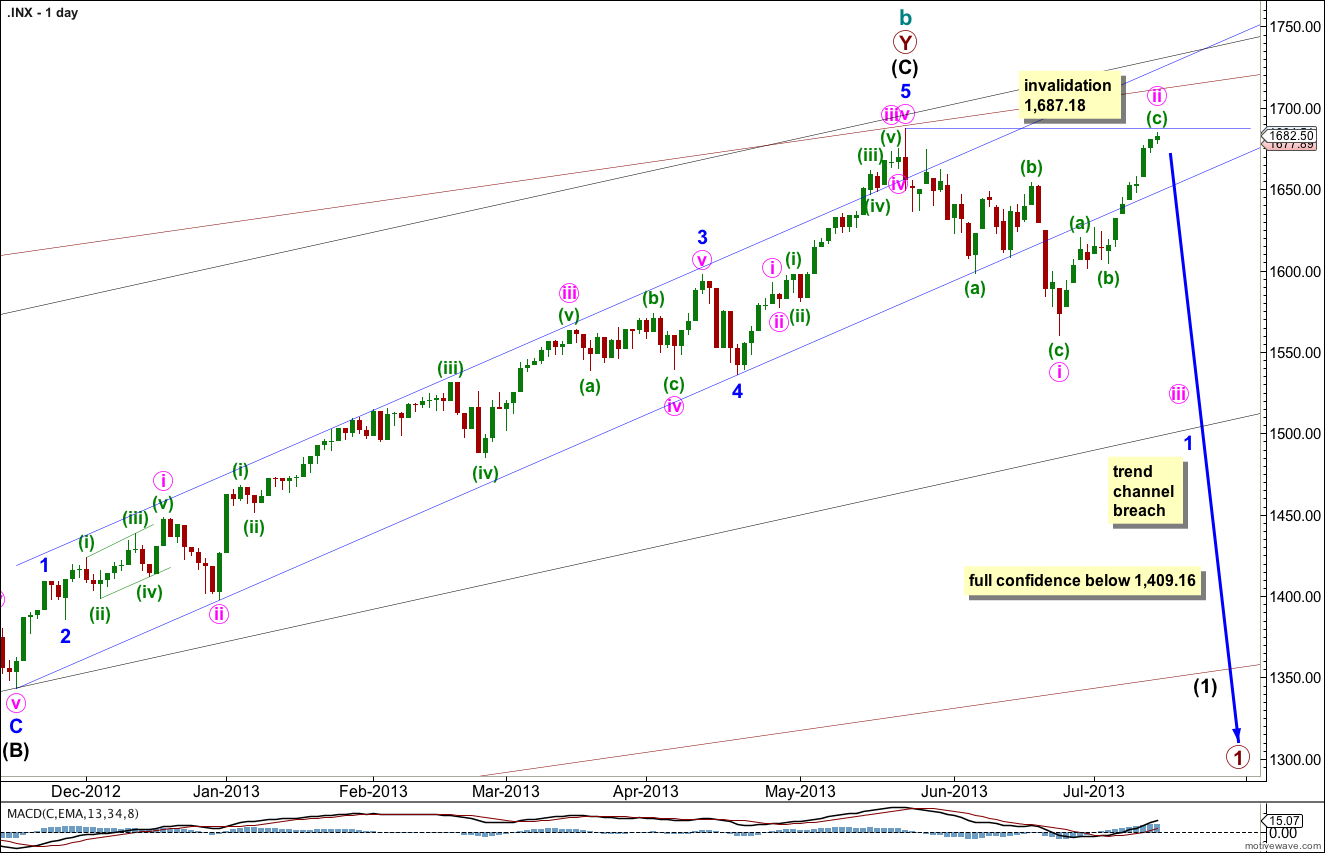
The widest maroon channel is copied over from the monthly chart and contains all of cycle wave b. It may be that price found final resistance at the upper edge of this channel.
The black channel in the middle is drawn about the zigzag of primary wave Y. Draw the first trend line from the start of primary wave Y to the end of intermediate wave (B). Place a parallel copy upon the extreme within intermediate wave (A). The upper edge of this channel also may be where price found resistance and where intermediate wave (C) ended.
The smallest blue channel is the most conservative best fit I can see for intermediate wave (C). It is very clearly breached by downwards movement.
What would give me confidence in this trend change is a clear breach of the black intermediate degree channel. When that is breached I will calculate long term downwards targets for you.
There is no classic technical divergence between price and MACD on the daily or weekly charts. This is possible, but unusual for the S&P 500. This must reduce the probability of this wave count.
There are no Fibonacci ratios between minor waves 1, 3 and 5 within intermediate wave (C). There is no Fibonacci ratio between intermediate waves (A) and (C). This lack of Fibonacci ratios slightly reduces the probability of this main wave count.
Minor wave 1 must be unfolding as a leading diagonal. Within the diagonal minute wave i is complete. Minute wave ii is either complete or very close to completion.
Minute wave ii may not move beyond the start of minute wave i. This wave count is invalidated with movement above 1,687.18.
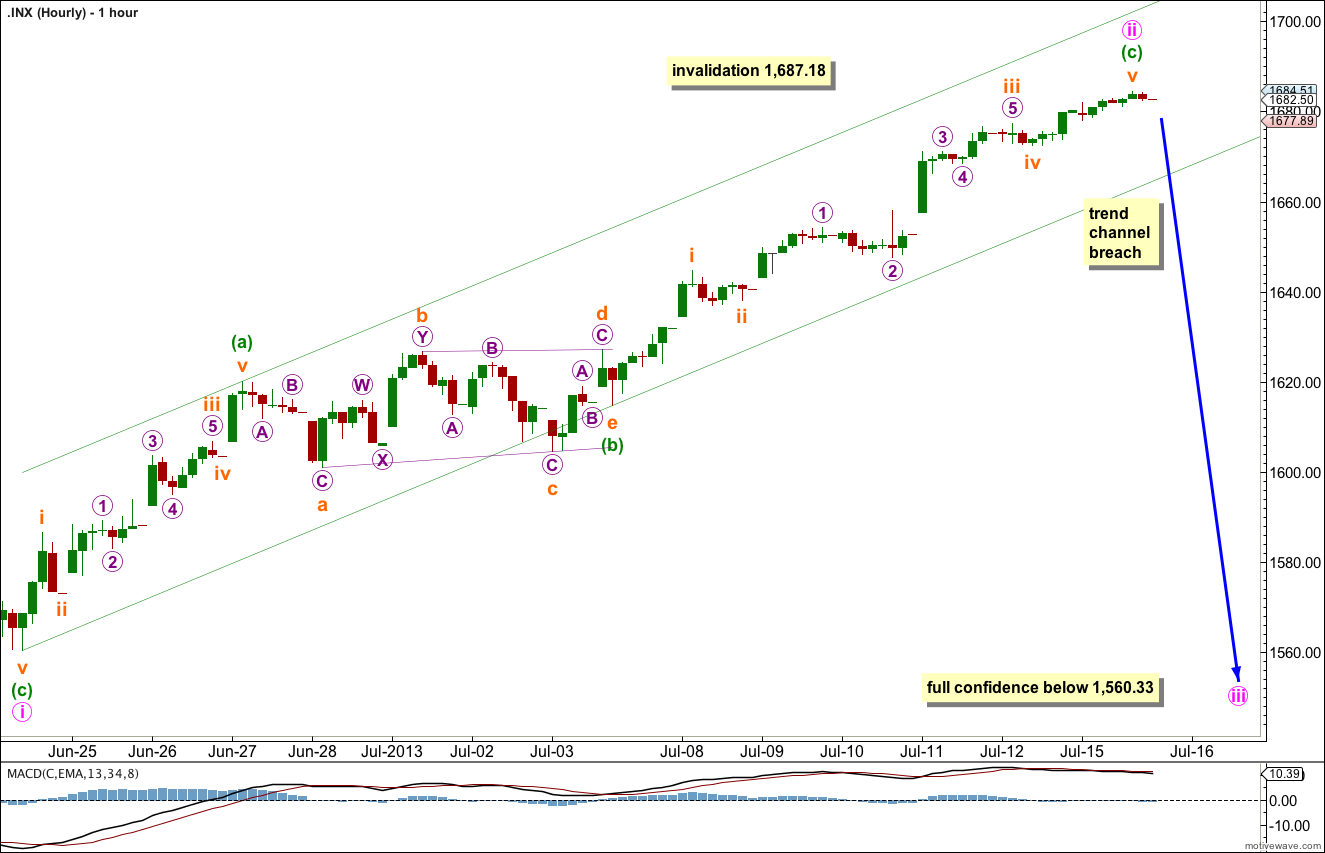
Upwards movement for Monday’s session may have been subminuette wave v extending further. While price has remained well within the channel containing minute wave ii we must accept that we have no confirmation of a mid term trend change.
Ratios within minuette wave (c) now are: subminuette wave iii has no Fiboancci ratio to subminuette wave i, and subminuette wave v is now just 0.73 points longer than 0.382 the length of subminuette wave i.
We need to see the small parallel channel drawn about minute wave ii clearly breached to have an indication that minute wave ii is over and minute wave iii is underway.
Minute wave ii is now 0.98 the length of minute wave i. This is an extremely deep second wave for a diagonal. The common length is between 0.66 to 0.81. This reduces the probability that this main wave count is correct and brings it down to even with the alternate wave count below.
There is almost no room left for upwards movement. If this wave count is correct then price must turn and move lower in a third wave this week, and we should see the channel breached on the hourly chart. If this main wave count is incorrect and the alternate is correct then price should move above 1,687.18 in the next day or two providing us with clarity. Even a bare fraction of a point would invalidate this main wave count.
Alternate Wave Count.
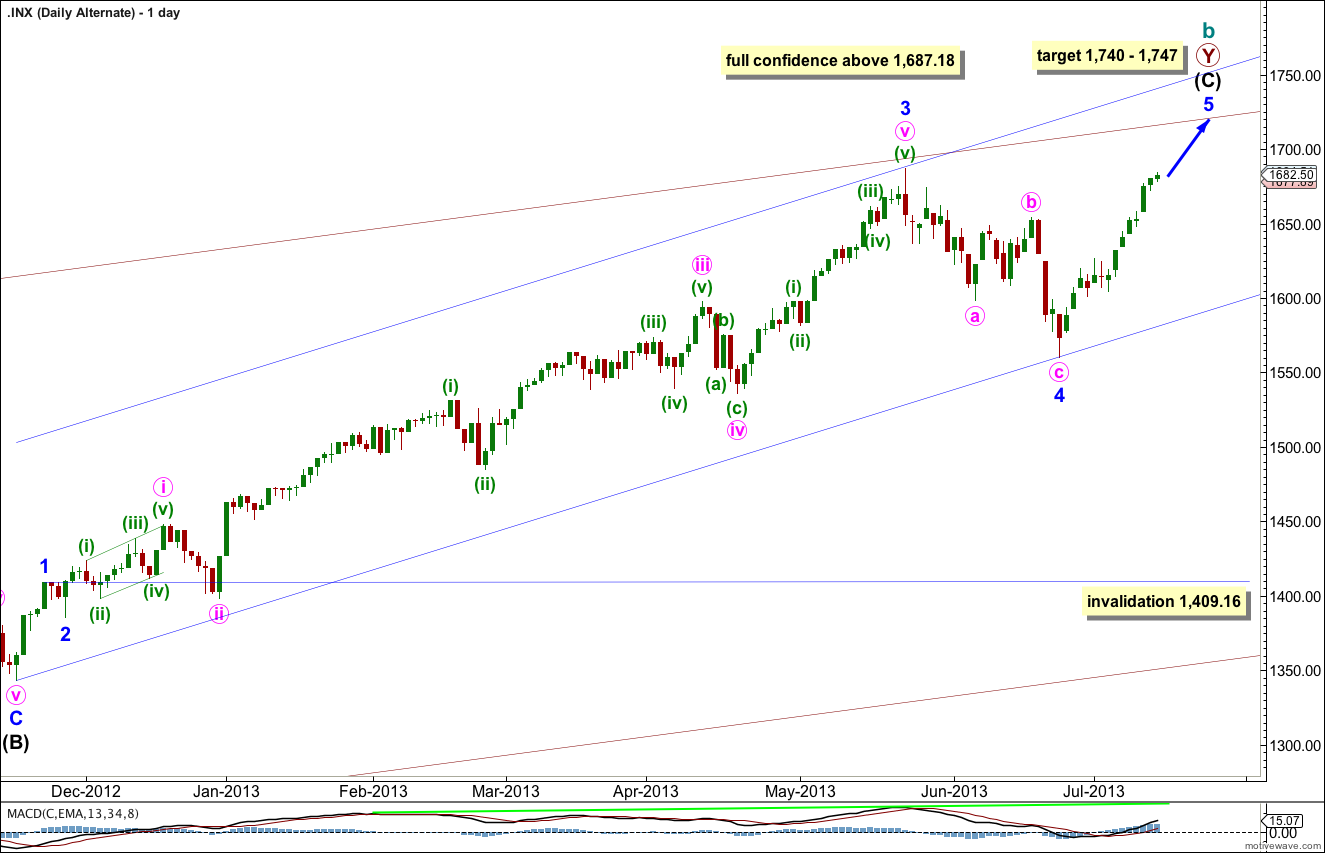
Minor wave 4 is out of proportion to all the other corrections within intermediate wave (C) reducing the probability of this wave count and giving it an odd look.
Within intermediate wave (C) minor wave 3 is 23 points longer than 4.236 the length of minor wave 1.
The lack of classic technical divergence between price and MACD supports this wave count. A final fifth wave up with slowing momentum would provide divergence and give a typical look in terms of momentum. So far within minor wave 5 minute waves i and ii may be complete, and minute wave iii may be almost complete.
At 1,740 intermediate wave (C) would reach equality with intermediate wave (A). At 1,747 minor wave 5 would reach 0.618 the length of minor wave 3.
Minor wave 4 may not move into minor wave 1 price territory. This wave count is invalidated with movement below 1,409.16. However, if a new low below 1,560.33 were to occur this wave count would look so strange and wrong it would be discarded.
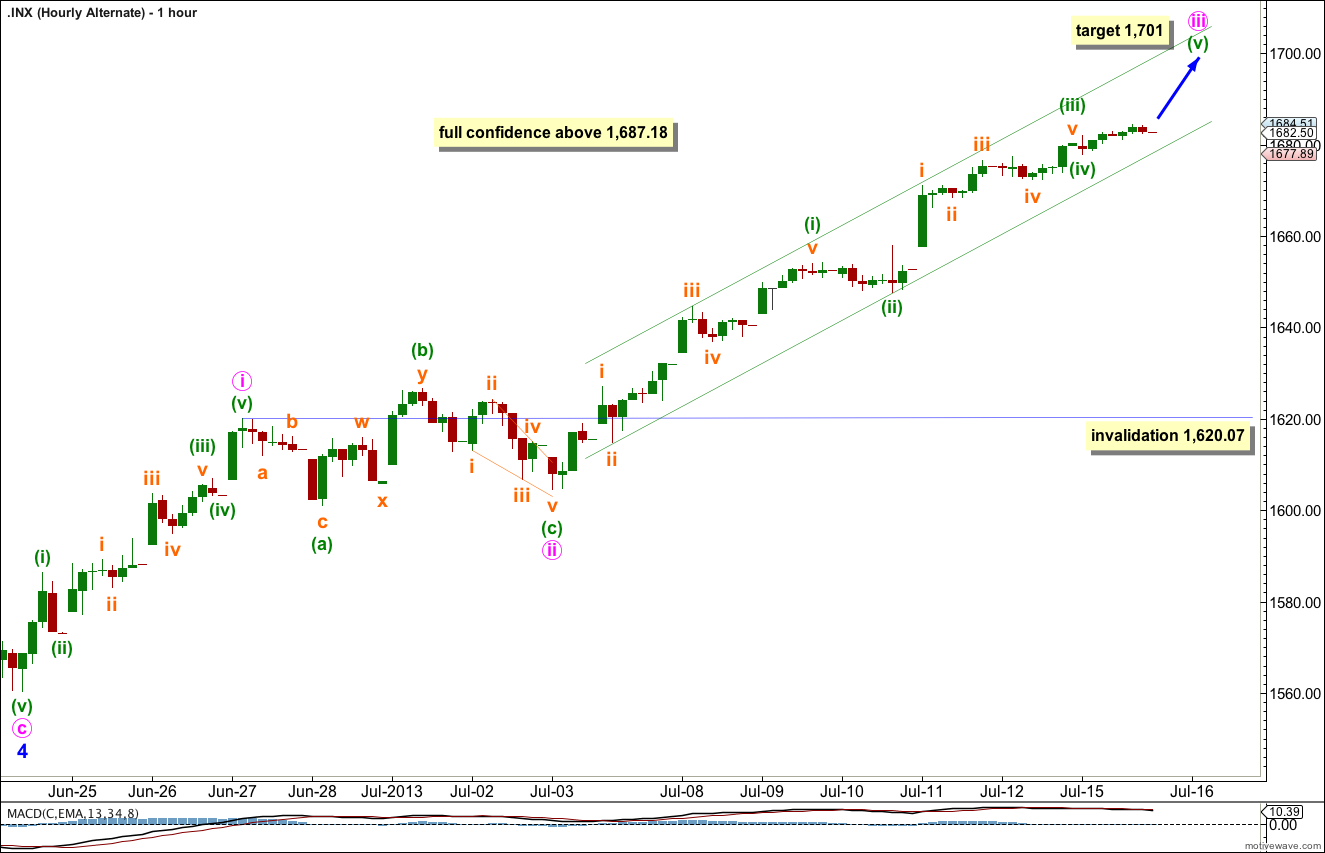
So far within minute wave iii minuette wave (iii) is 1.92 points longer than 0.618 the length of minuette wave (i). We may not see a Fibonacci ratio between minuette wave (v) and either of minuette waves (i) or (iii).
Minute wave iii would reach 1.618 the length of minute wave i at 1,701.
Minute wave iv downwards should follow and may not move into minute wave i price territory. This wave count is invalidated at that stage with movement below 1,620.07.
If price fails to break above 1,687.18 this week, and turns and moves below 1,620.07 then for this alternate wave count an ending diagonal may be unfolding for minor wave 5.
Only movement below 1,560.33 would finally invalidate this alternate wave count.