
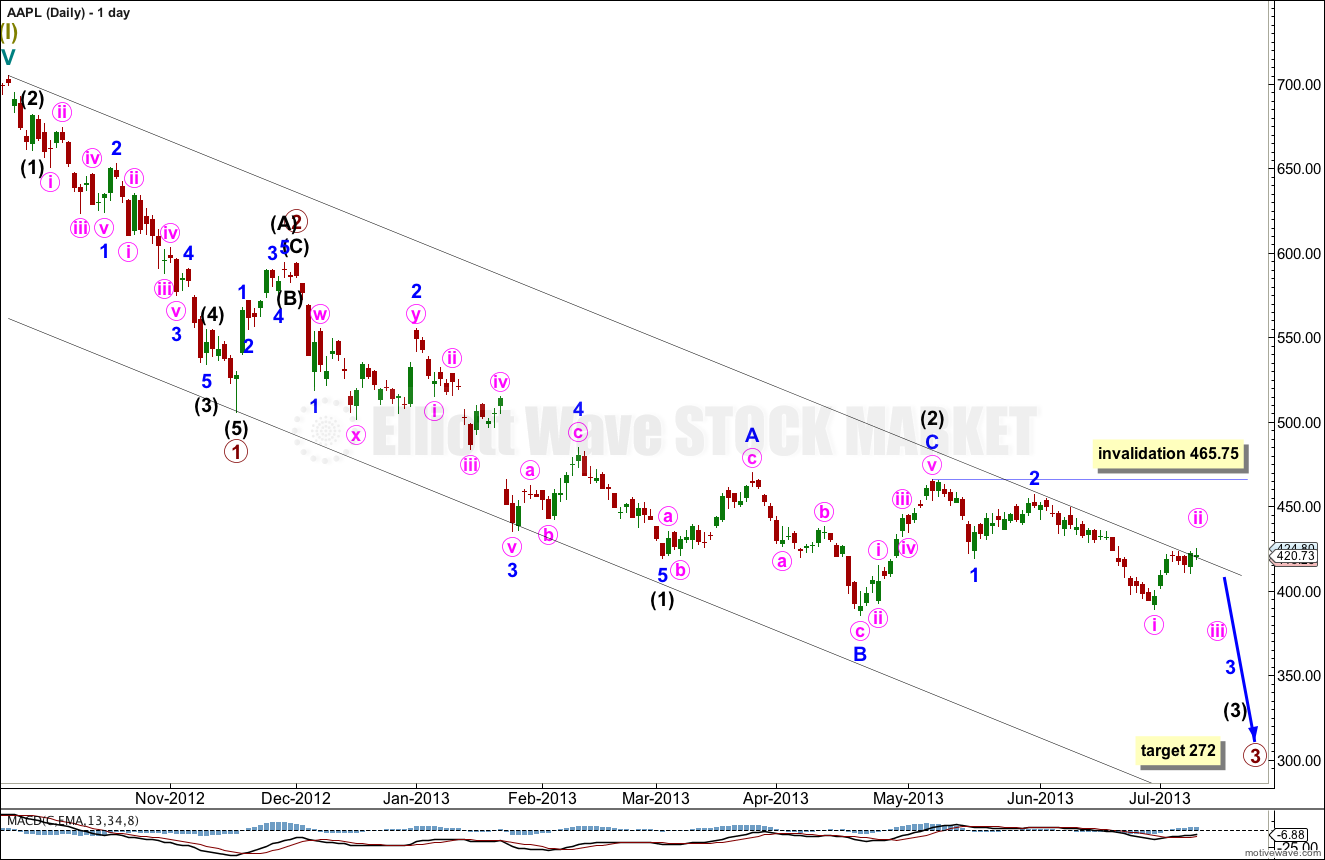
Tomorrow I will publish a full analysis of AAPL. Today I want to publish updated charts because I can now calculate a target for this second wave correction to end. Notes are on charts below.
Daily Chart.
Hourly Chart.

Use the small parallel channel drawn about minute wave ii to indicate when it is over. When this channel is clearly breached by downwards movement expect a strong third wave may have begun.
Hello Lara. I sent you my AAPL wave count yesterday. Please review it and let us know your thiughts