
Upwards movement breached the short term invalidation point on both hourly wave counts during Friday’s session.
Price remains range bound. We need to see it break above 1,654.19 or below 1,560.33 to have clarity next week.
Click on the charts below to enlarge.
Main Wave Count.
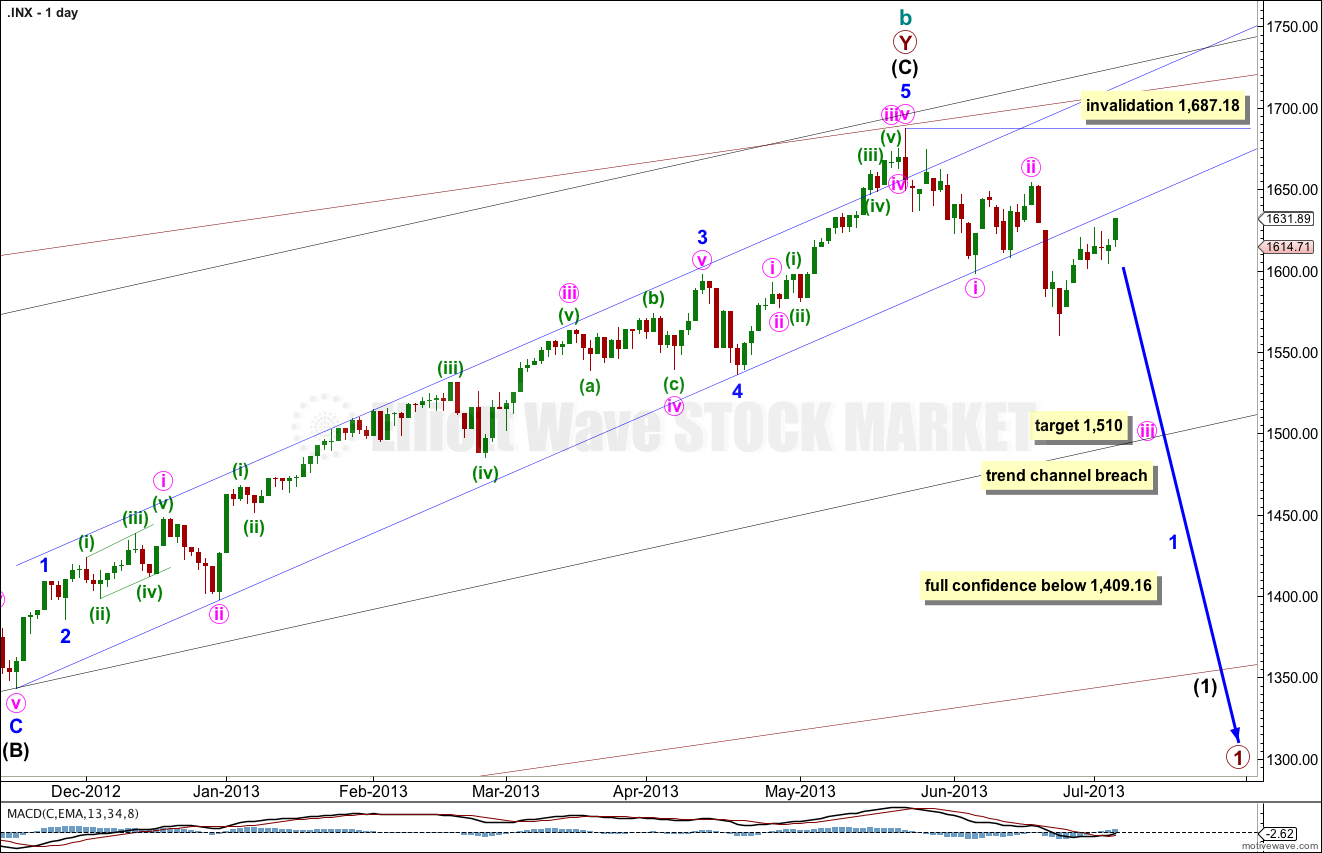
The widest maroon channel is copied over from the monthly chart and contains all of cycle wave b. It may be that price found final resistance at the upper edge of this channel.
The black channel in the middle is drawn about the zigzag of primary wave Y. Draw the first trend line from the start of primary wave Y to the end of intermediate wave (B). Place a parallel copy upon the extreme within intermediate wave (A). The upper edge of this channel also may be where price found resistance and where intermediate wave (C) ended.
The smallest blue channel is the most conservative best fit I can see for intermediate wave (C). It is very clearly breached by downwards movement. The lower edge of this channel may be providing some resistance now to upwards movement.
I have looked back to September 2000 on the daily chart at smaller narrow channels about intermediate degree movements. Most of the time a breach like this indicates a trend change, but not always. What would give me more confidence in this trend change is a clear breach of the black intermediate degree channel. When that is breached I will calculate long term downwards targets for you.
There is no classic technical divergence between price and MACD on the daily or weekly charts. This is possible, but unusual for the S&P 500. This must reduce the probability of this wave count. We must still seriously consider the alternate.
There are no Fibonacci ratios between minor waves 1, 3 and 5 within intermediate wave (C). There is no Fibonacci ratio between intermediate waves (A) and (C). This lack of Fibonacci ratios slightly reduces the probability of this main wave count.
Minor wave 2 may not move beyond the start of minor wave 1. This wave count is invalidated with movement above 1,687.18.
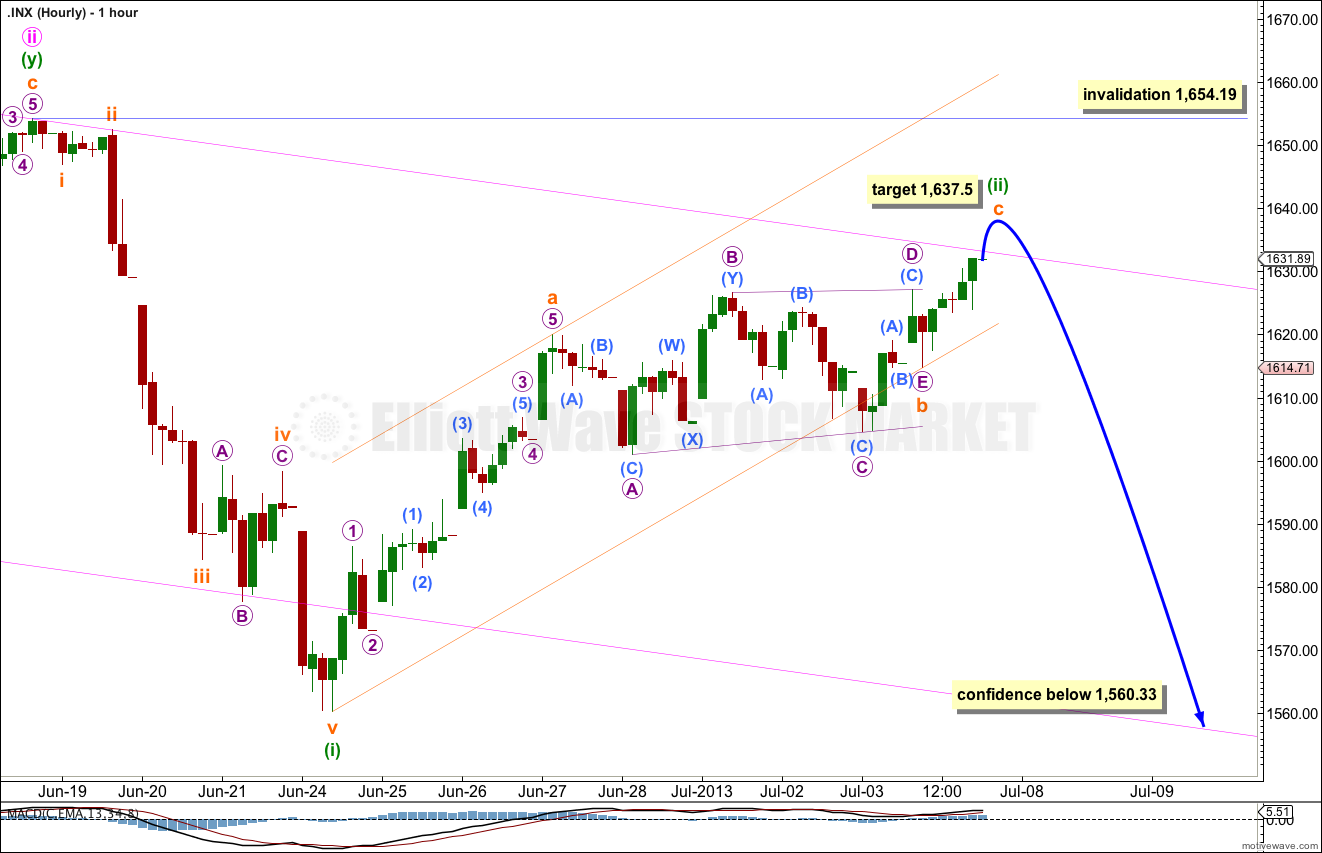
Movement above 1,626.61 has invalidated the labeling of minuette wave (ii) as complete. Sideways movement for last week fits reasonably well as a barrier triangle which may have been subminuette wave b. All the subdivisions fit perfectly, and one of the subwaves of the triangle is a double zigzag which should be expected.
Following barrier triangles the movement out of them is often a short sharp thrust. Subminuette wave c may be over at the end of Friday’s session, and on the five minute chart it is a perfect five wave impulse. Alternatively, within it the final fifth wave may continue upwards a little further. If it reaches up to 1,637.50 then subminuette wave c would reach 0.382 the length of subminuette wave a. If it does not move any higher then there would be no Fibonacci ratio between subminuette waves a and c.
Price may have found resistance at the upper edge of the parallel channel drawn about this downwards movement. The channel is drawn first with a trend line from the all time high at 1,687.18, to the high labeled minute wave ii. A parallel copy is placed upon the low of minuette wave i.
Draw also a small channel about minuette wave (ii) using Elliott’s technique. When this small upwards sloping orange channel is clearly breached by downwards movement on the hourly chart then we may take that as confirmation that minuette wave (ii) is finally over and minuette wave (iii) is underway.
Movement below 1,560.33 next week would provide strong confidence in this wave count.
Minuette wave (ii) may not move beyond the start of minuette wave (i). This wave count is invalidated with movement above 1,654.19.
Atlernate Wave Count.
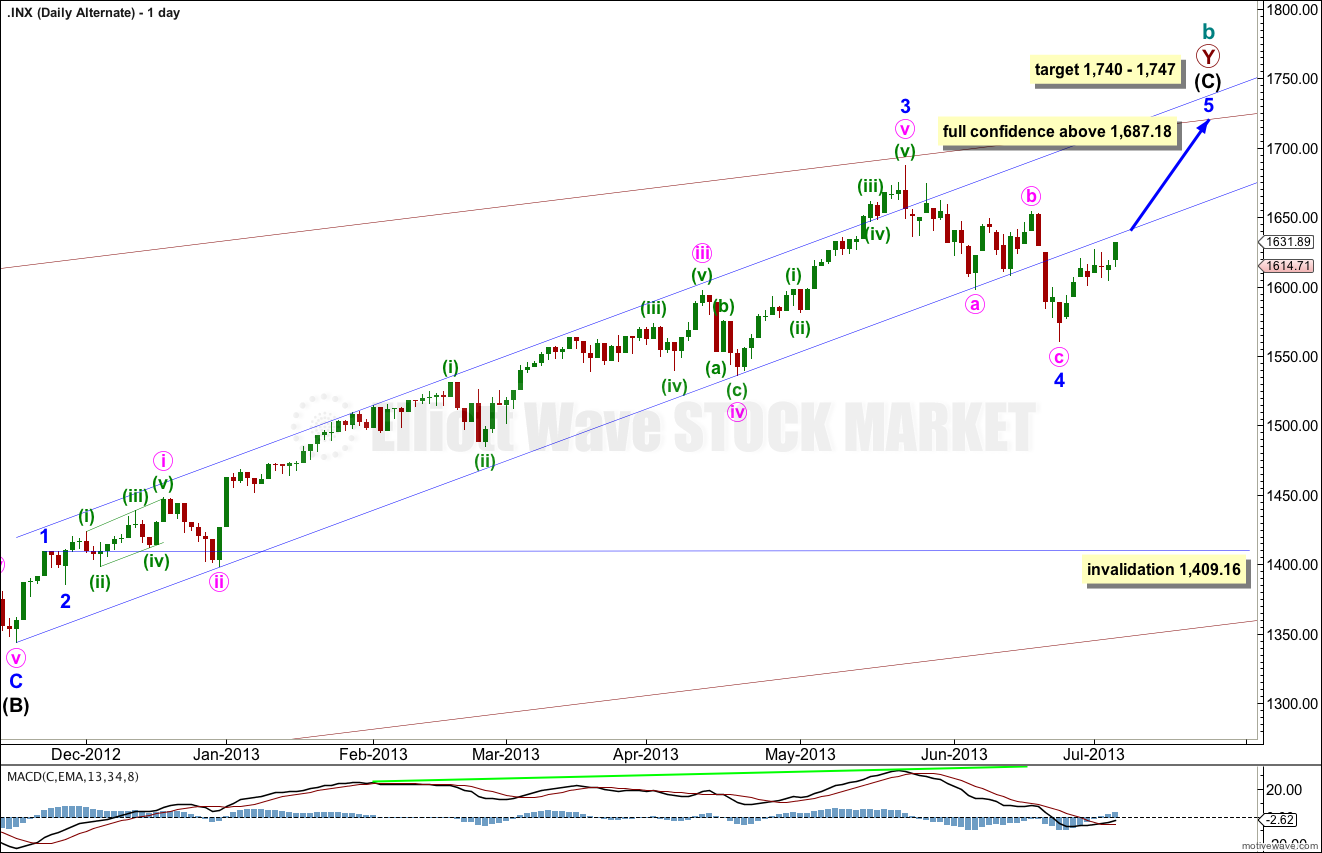
The biggest problem with this wave count and the reason it is an alternate is the size of minor wave 4: it is out of proportion to all the other corrections within intermediate wave (C) and clearly breaches a channel containing intermediate wave (C) no matter how that channel is drawn. Sometimes fourth waves do this and so we must consider this possibility.
Within intermediate wave (C) minor wave 3 is 23 points longer than 4.236 the length of minor wave 1.
The lack of classic technical divergence between price and MACD supports this wave count. A final fifth wave up with slowing momentum would provide divergence and give a typical look.
At 1,740 intermediate wave (C) would reach equality with intermediate wave (A). At 1,747 minor wave 5 would reach 0.618 the length of minor wave 3.
Minor wave 4 may not move into minor wave 1 price territory. This wave count is invalidated with movement below 1,409.16.
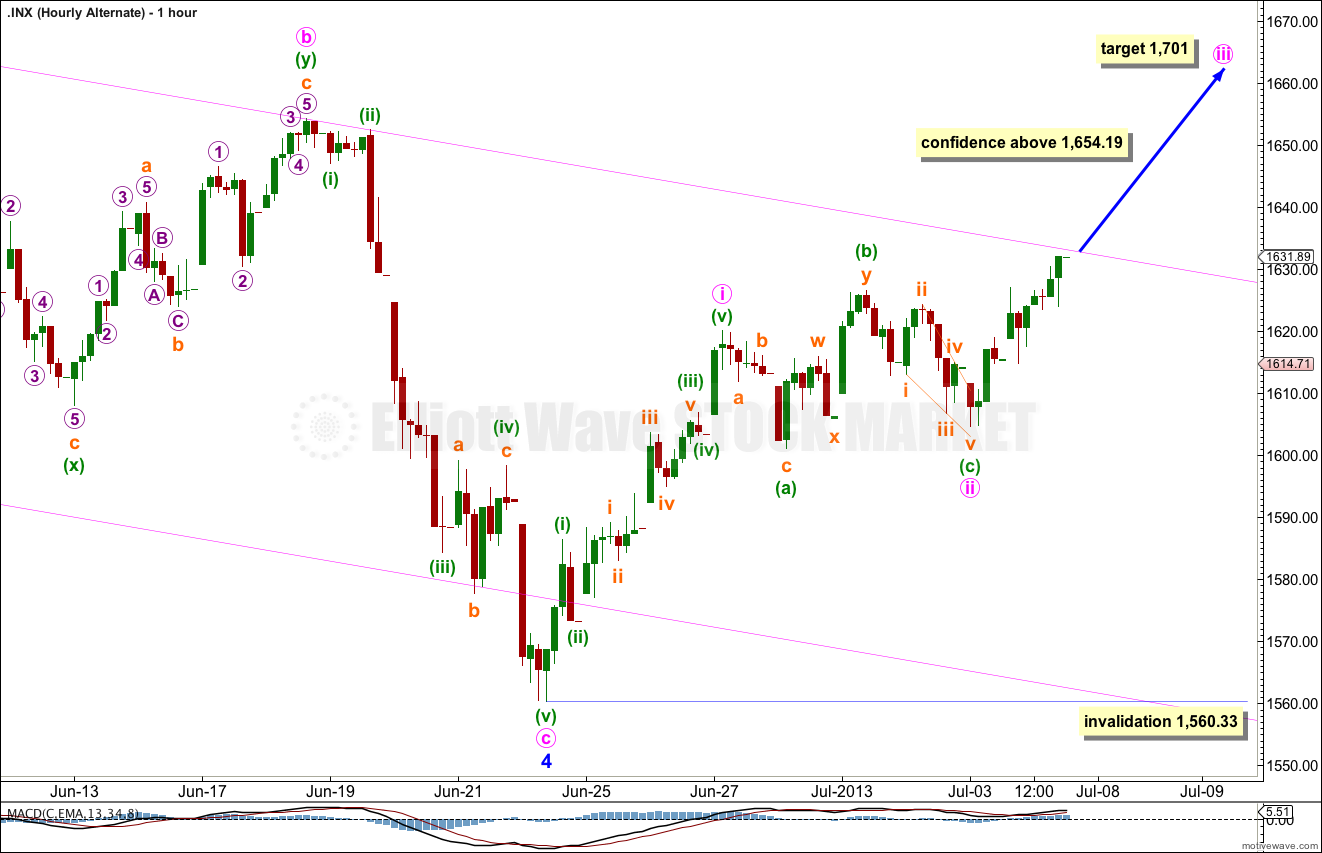
At this stage the only explanation I can see now on the hourly chart for a new upwards trend is a rare running flat for minute wave ii. This further reduces the probability for this wave count.
Upwards movement for Friday’s session would be the start of minuette wave iii. At 1,701 minuette wave iii would reach 1.618 the length of minuette wave (i).
Movement above 1,654.19 would provide some confidence for this alternate wave count. However, it would not invalidate the main wave count at the daily chart level. Only movement above 1,687.18 would provide full confidence in this wave count.
Lara … could you do one of your great why this charts suc$ http://charts.stocktwits.net/production/original_14450951.png?1373047816
Thanks
This wave count would have a reduced probability as the X wave is a running flat.
Within the X wave it has a C wave that subdivides into A-B-C. This is invalid. C waves can only subdivide 1-2-3-4-5.
nice … thank you.
Lara, thank you for all the time you spent this weekend on updating the charts and the reports. After Friday’s session I am sure you had to do a lot of analysis to get to this point. 1631.89 and 1654.19 will be on my Radar for sure.
Have a great week!
Gregg
You’re welcome!
When I first looked at what it had done on Friday I was stumped. It took a while to figure out the main hourly wave count, but once I looked at the possibility of a triangle it fell into place.
The alternate…. I’m still trying to see another explanation on the hourly chart which avoids a rare running flat because it just doesn’t make sense…
Hi Lara,
Can you explain briefly why you are not considering the possibility of all the movement down from the top of ‘cycle wave b’ as being a leading expanding triangle for minute wave 1 ?
This option would suggest that all the upwards movement from the recent low was part of minute wave 2…..which could maybe result in more upwards movement, whilst still maintaining a bearish scenario.
Many thanks,
Craig
Sure.
I have mentioned it a few times as a possibility. And if the main wave count is invalidated with movement above 1,654.19 this would be the wave count I would go with.
However it has a lower probability than the more common series of 1-2, 1-2 which the main hourly wave count has.
In order to keep the number of charts manageable I’m publishing only the most likely scenario for each daily wave count.
Thanks for your unbiased, scientific sound, emotion free analysis and reporting. It much appreciated here. Gregg
OK
Thanks Lara