
Movement below 1,597.35 has invalidated the wave count.
I have two wave counts for you today. We may use confirmation / invalidation points to work with these wave counts over the next week or so. I will look back at the monthly / weekly chart in today’s video to see the bigger picture and to look closely at the behaviour of price and MACD about turning points.
Click on the charts below to enlarge.
Main Wave Count.
The bigger picture sees upwards movement from the end of the “credit crunch” at 666.76 as a double zigzag structure for a cycle degree b wave lasting so far 4.25 years. The second zigzag is almost complete. When it is done we should see another crash to make substantial new lows below 666.76, if the main monthly wave count is correct.
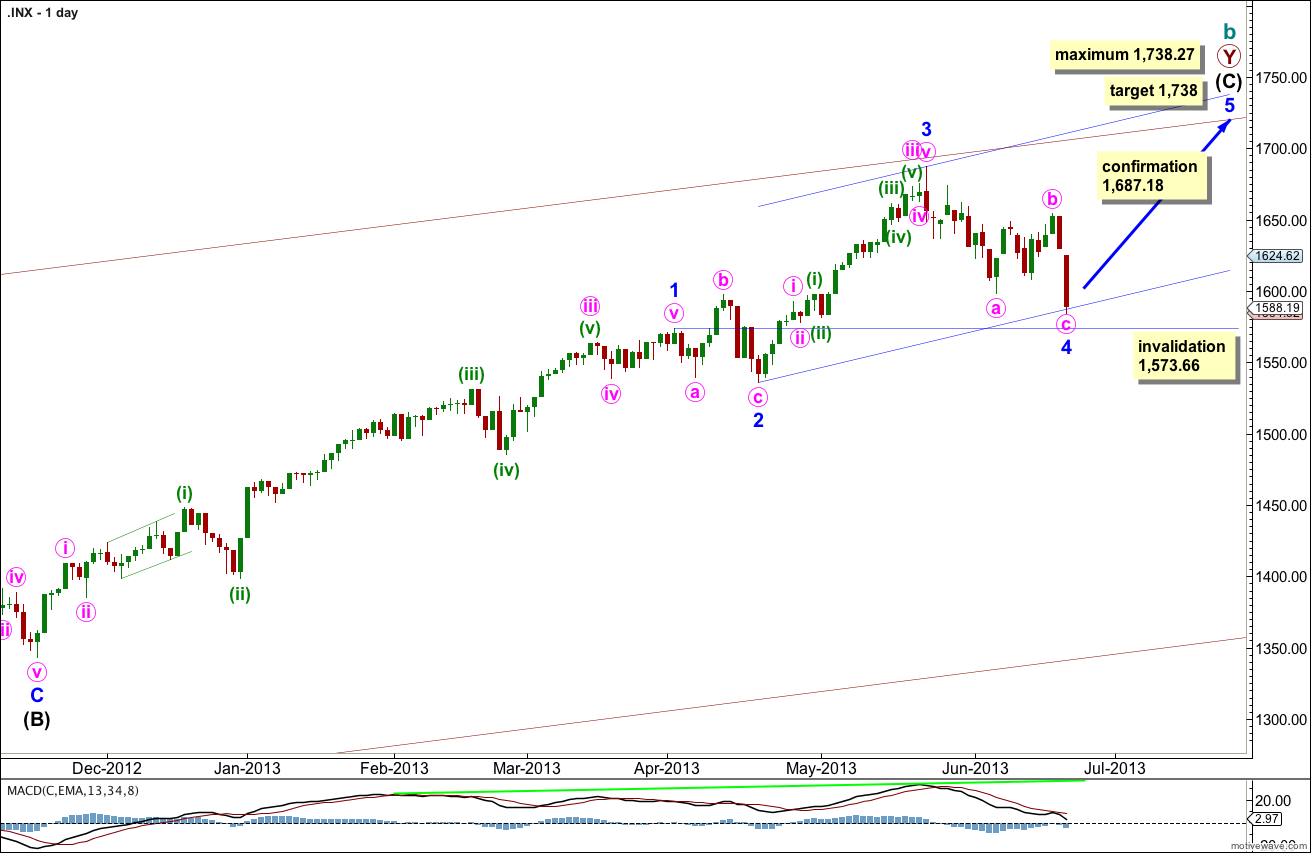
Within intermediate wave (C) I have moved the labeling for the end of minor wave 1 lower, leaving minor wave 2 as an expanded flat correction. This still agrees with MACD as the strongest momentum is within the third wave of intermediate wave (C).
Minor wave 3 is just 8.82 points longer than 0.618 the length of minor wave 1. I would expect the upcoming minor wave 5 to reach equality with minor wave 3. This would be achieved at 1,738. At 1,738.27 exactly is the maximum point for upwards movement because minor wave 3 may not be the shortest wave.
At 1,738 intermediate wave (C) would be just 2 points short of equality with the orthodox length of intermediate wave (A).
If minor wave 4 were to continue any lower it may not move into minor wave 1 price territory. This wave count is invalidated with movement below 1,573.66
Draw the channel about intermediate wave (C) using Elliott’s second technique. Draw the first trend line from the lows of minor waves 2 to 4, then place a parallel copy upon the hight of minor wave 3. Expect minor wave 5 to end about the mid line, or to find resistance at the upper edge.
The very wide maroon trend channel shown here is copied over from the monthly chart. We may find this movement ends as it finds resistance at the upper trend line.
At this stage there is no divergence on the daily chart level with price trending higher and MACD also trending higher. This is an indication that the upwards trend remains in place. I would expect to see some classic technical divergence before the end of this trend.
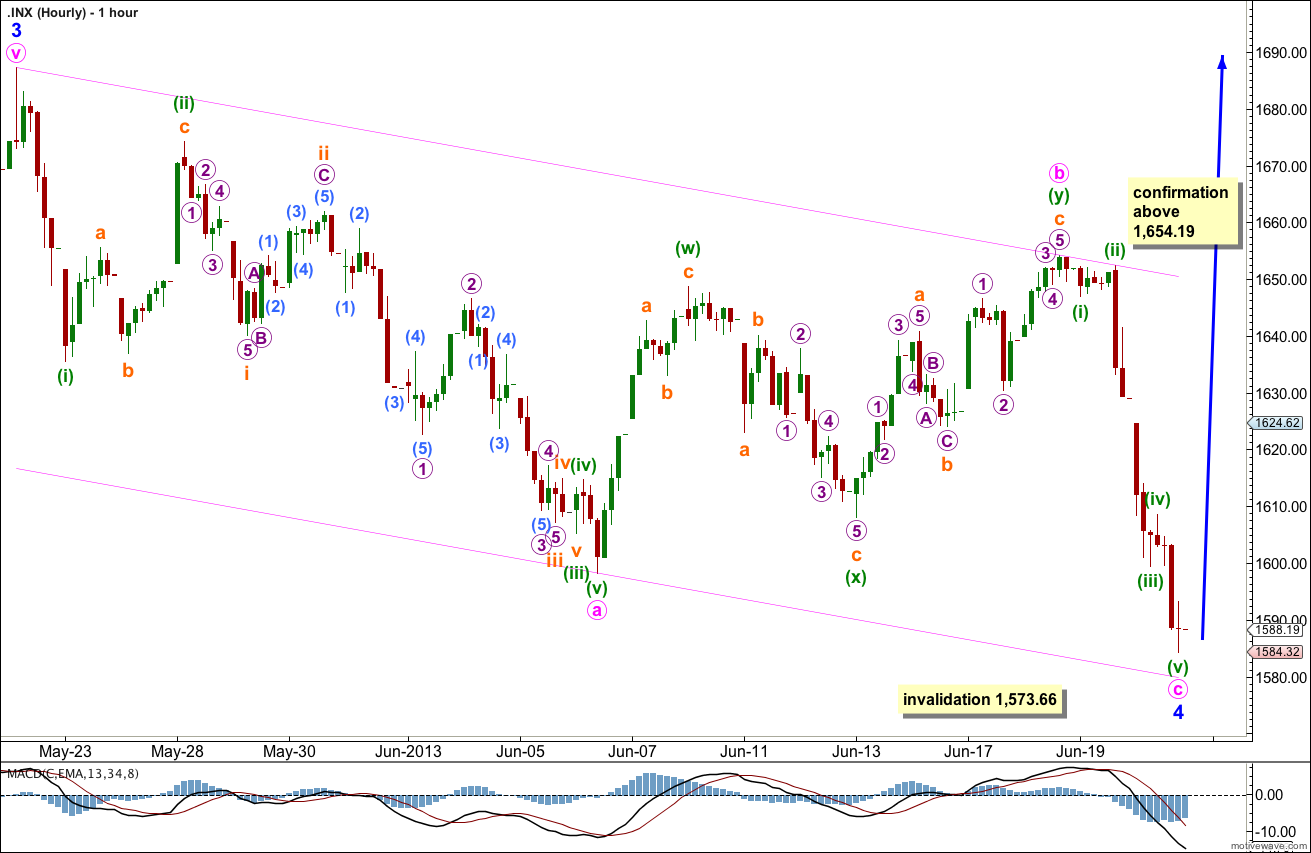
Within minor wave 4 the key to this wave count is the three upwards labeled minute wave b. This subdivides 3-3-3, and I would not want to try and see it as 3-3-5.
Because three is the maximum number of structures within a multiple this means waves within a multiple (labeled W-X-Y and Z) cannot themselves subdivide as multiples. This means that the upwards movement labeled on the chart above minute wave b cannot be an X wave. It would not have the right look either as X waves are not usually that shallow.
So far within minor wave 4 there is no Fibonacci ratio between minute waves a and c. It cannot be confirmed that minute wave c is complete as the final fifth wave within it may yet move lower. If it does tomorrow then I would expect it to find support at the lower end of the channel containing minor wave 4 zigzag.
Within minute wave a this structure can be seen as a five wave impulse, although the lack of proportion between the first and fourth waves gives this structure a three wave look.
Within minute wave c the structure may be complete, or the final fifth wave may move a little lower. Minor wave 4 may not move into minor wave 1 price territory. This wave count is invalidated with movement below 1,573.66.
Alternate Wave Count.
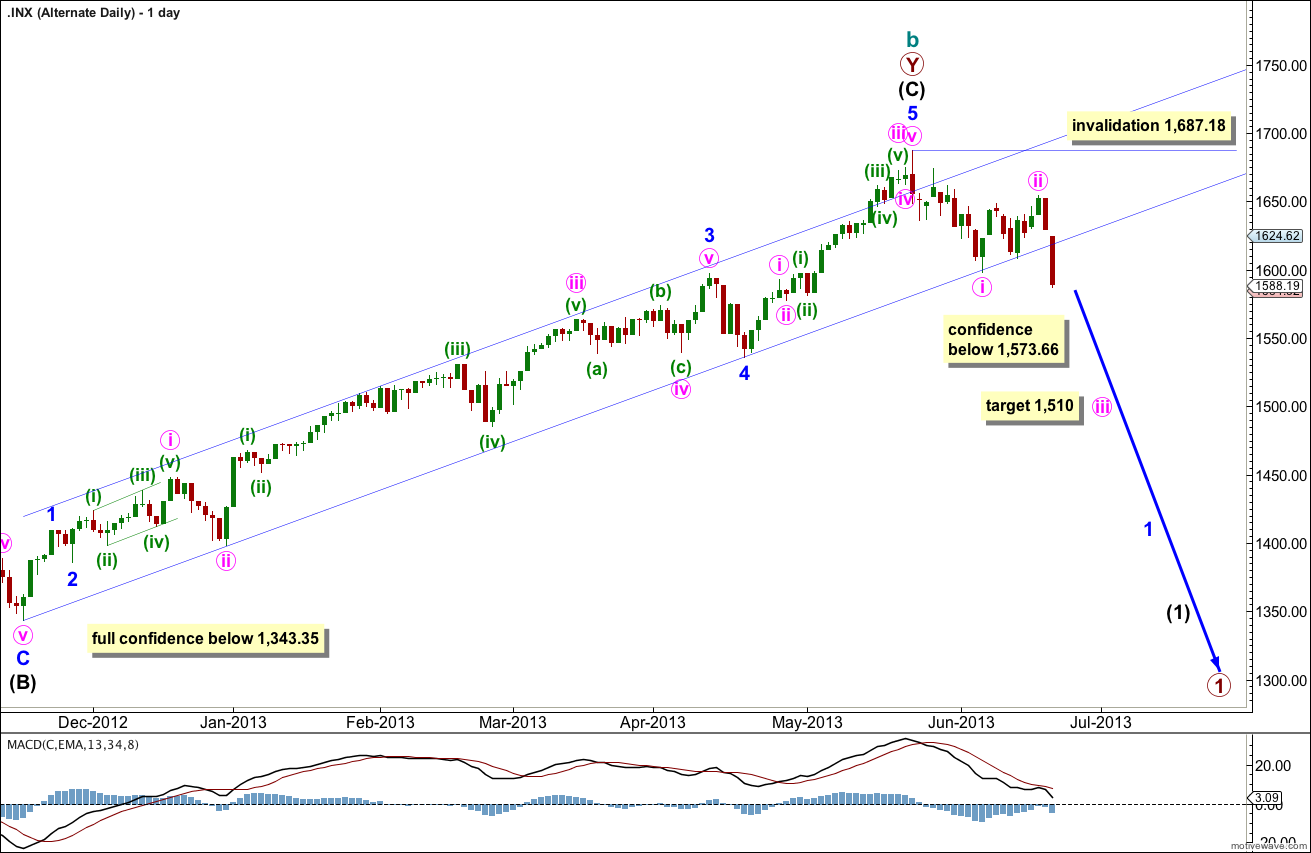
The labeling here within intermediate wave (C) goes back to my previous wave count up to 15th May, 2013. Within intermediate wave (C) it may have been minor wave 3 which was extended and not minor wave 1. This is more common. The problem with this wave count (and the reason why I changed it) is that it does not agree with MACD: the strongest upwards momentum within intermediate wave (C) impulse is within minor wave 5, and also the steepest slope is within minor wave 5. For the S&P 500 this is uncommon as normally the third wave exhibits strongest momentum and steepest slope. For these reasons this wave count is an alternate.
Within intermediate wave (C) there are no Fibonacci ratios between minor waves 1, 3 and 5.
A parallel channel drawn as a best fit about intermediate wave (C) is clearly breached by downwards movement. This may be an early indication that we have seen a trend change.
At 1,510 minute wave iii would reach 1.618 the length of minute wave i.
Movement below 1,573.66 would provide some confidence in this wave count as at that stage the main wave count would be invalidated. Movement below 1,343.35 would provide full and final confidence that we have seen a trend change at cycle degree and price should continue to fall with strong momentum ending significantly below 666.76.
Within the new downwards trend minor wave 2 may not move beyond the start of minor wave 1. This wave count is invalidated with movement above 1,687.18.
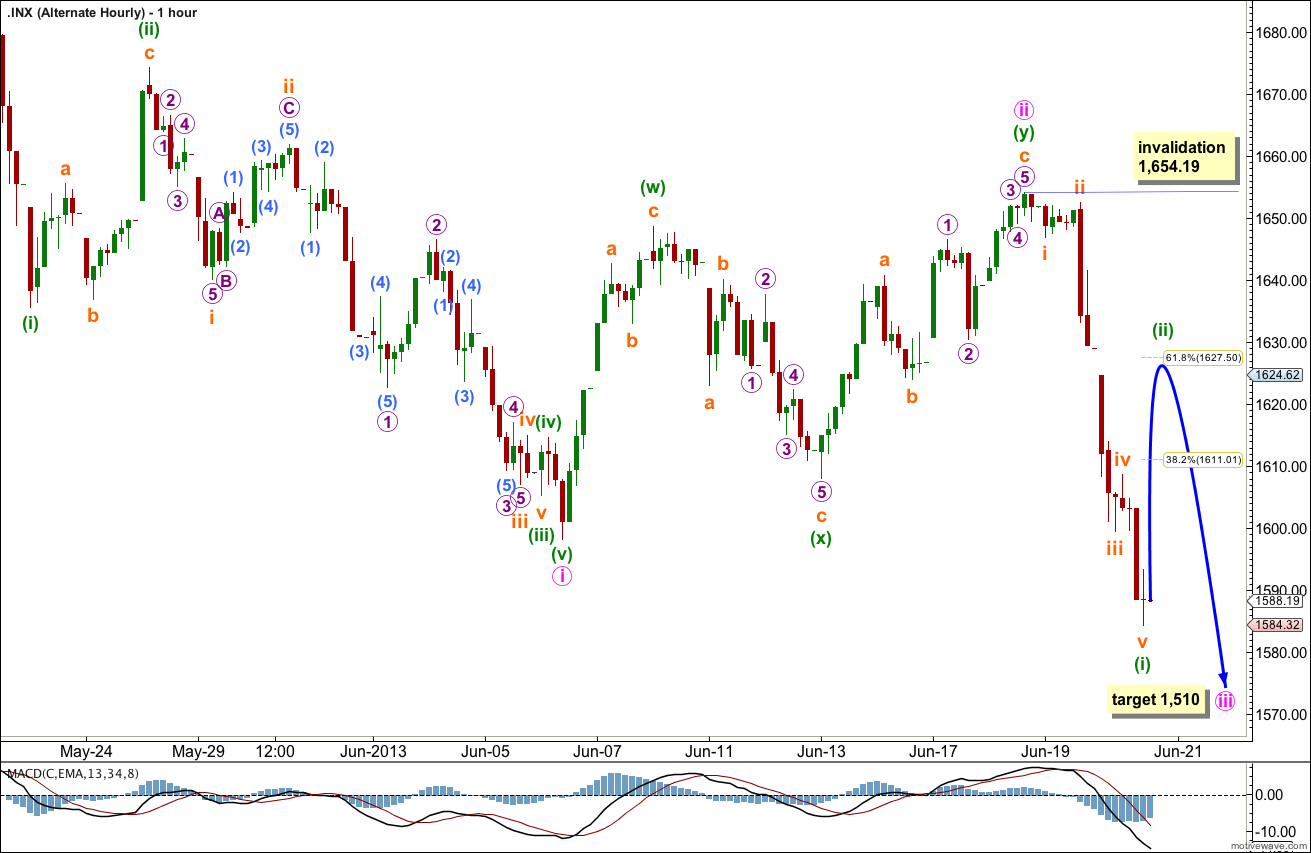
The subdivisions of an A-B-C and a 1-2-3 are the same. At the hourly chart level the subdivisions within the two wave counts are the same, but the difference is the labeling of 1-2-3 for this alternate whereas the main is labeled A-B-C.
Within minute wave iii minuette wave (i) is unlikely to be complete. This alternate expects a further increase in downwards momentum over the next few days.
So far a five down is complete. This should be followed by a second wave correction. Minuette wave (ii) may reach up to the 0.618 Fibonacci ratio at 1,627.50 and just above in order to fill the gap created at the beginning of Thursday’s session. Thereafter, minuette wave (iii) must take price to new lows with an increase in momentum.
Minuette wave (ii) may not move beyond the start of minuette wave (i). This wave count is invalidated with movement above 1,654.19.
The party is over EMA(13) closed under EMA(34) http://scharts.co/10F1J10 target under 1500.00
Hi Karen,
Wouldn’t you expect the shorter EMA to move below the longer EMA during a deep wave 4 re-trace ? What’s your thinking here ?
I’d be more inclined to believe the bullish divergence in the McClellan indicator.
Craig
NYMO -97.22% @1608 vs today’s CLOSE -79.53% @ 1588.19 $SPX http://stks.co/qHaU // bullish