
Last analysis expected the completion within one or two days of a small second wave correction and thereafter a trend change to the downside during the week. Downwards movement was expected to show an increase in momentum which is what we have seen in the last 24 hours.
Click on the charts below to enlarge.
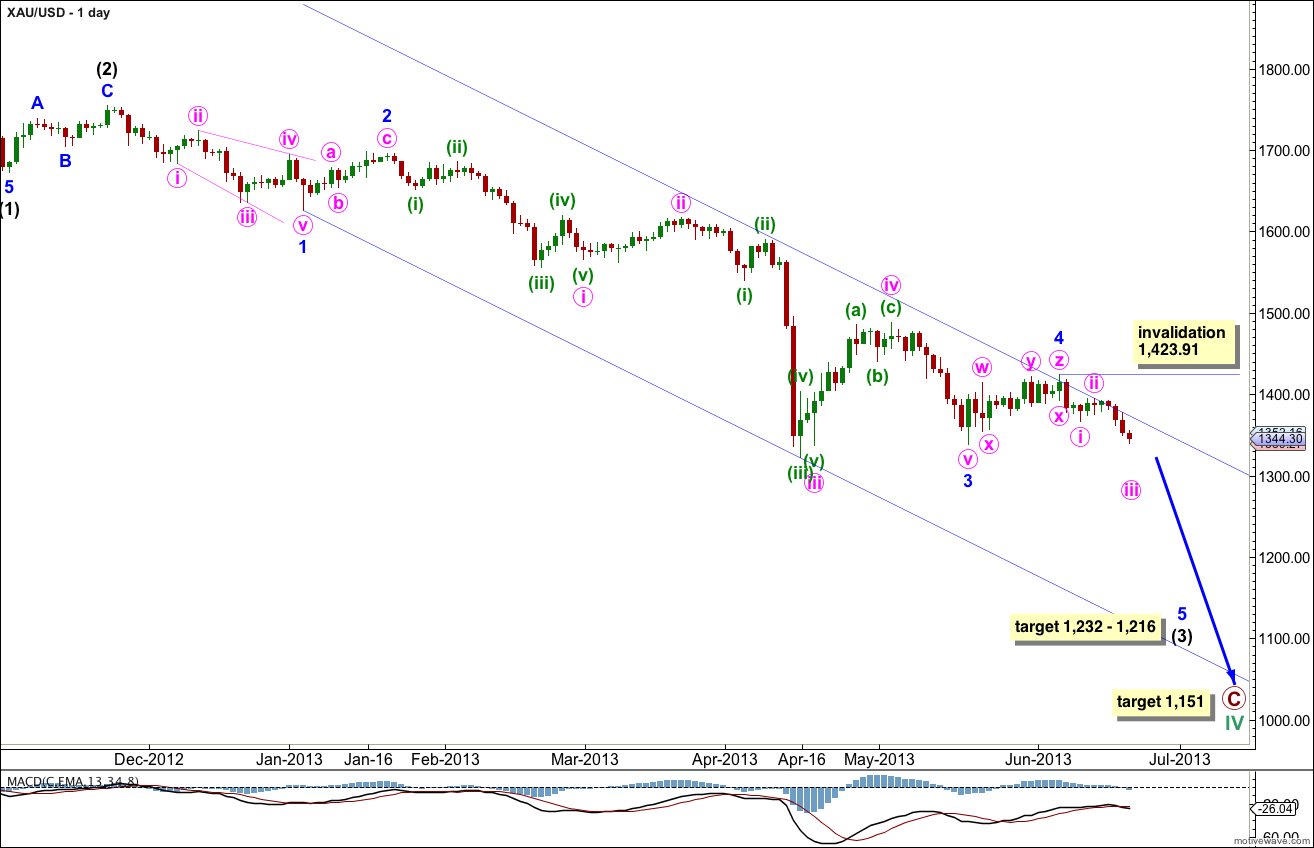
This daily chart focuses on the new downwards trend of primary wave C.
Within primary wave C intermediate waves (1) and (2) are complete. Intermediate wave (3) is underway and may have just passed the middle of it.
Within intermediate wave (3) minor waves 1, 2, 3 and 4 are complete.
At 1,232 intermediate wave (3) would reach 4.236 the length of intermediate wave (1). At 1,216 minor wave 5 would reach 1.618 the length of minor wave 1. This gives a $16 target zone which should be about 6 weeks away.
At 1,151 primary wave C would reach 1.618 the length of primary wave A. This target is a long term target.
Within minor wave 5 minute wave ii may not move beyond the start of minuette wave i. This wave count is invalidated with movement above 1,423.91.
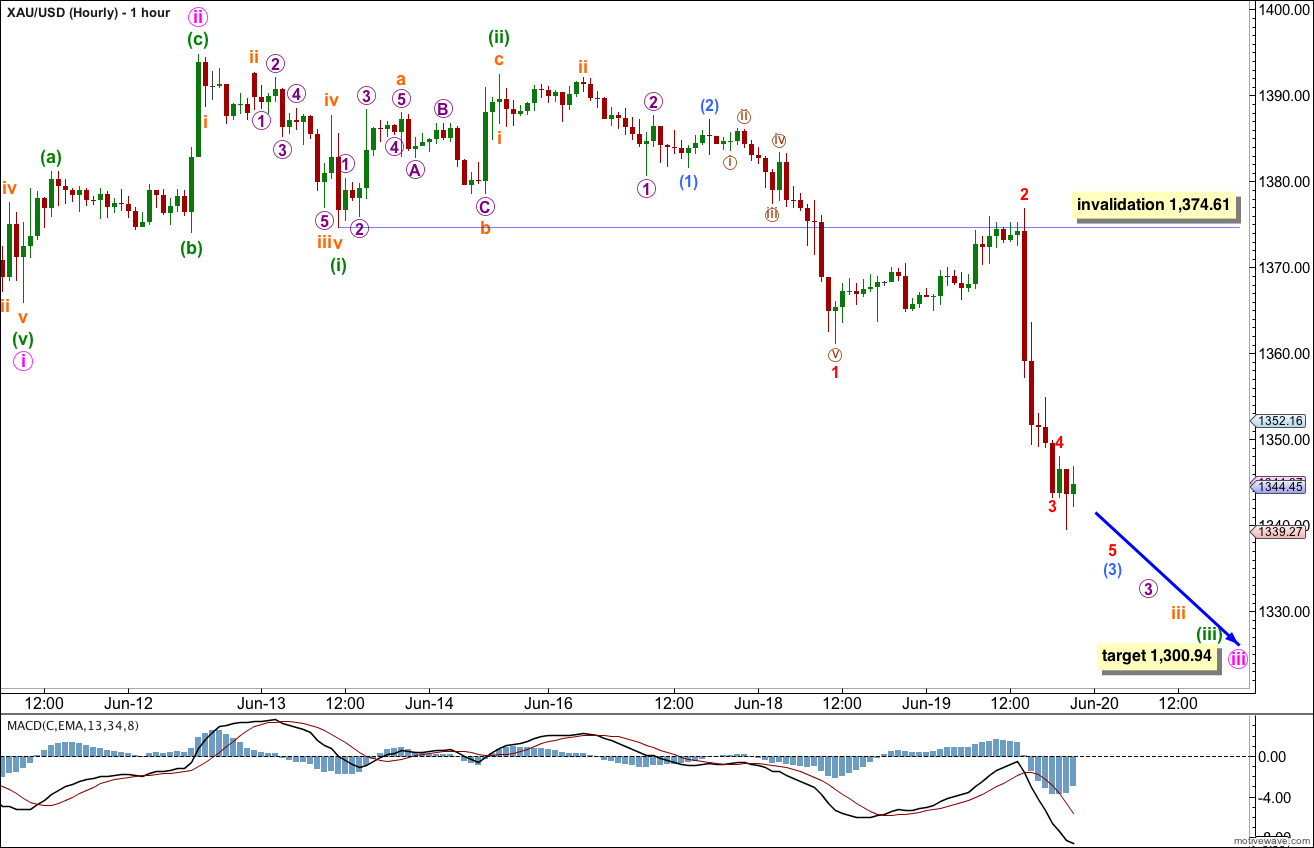
Within minor wave 4 I have this week moved the degree of labeling up one degree. Minute waves i and ii are complete.
Minute wave iii is incomplete. At 1,300.94 it would reach 1.618 the length of minute wave i. This target may be reached within another five days or so.
When minute wave iii is complete we can draw a parallel channel about this new downwards wave. It is too early to do that yet.
Within minute wave iii minuette wave (iii) is incomplete. It may be finished within a few days. The following correction for minuette wave (iv) may not move back into minuette wave (i) price territory. This wave count is invalidated with movement above 1,374.61.