
Yesterday’s analysis had two hourly wave counts. The main wave count was invalidated with movement below 1,622.92 and the alternate was confirmed. Price continued lower to reach the target on the alternate hourly wave count.
Click on the charts below to enlarge.
The bigger picture sees upwards movement from the end of the “credit crunch” at 666.76 as a double zigzag structure for a cycle degree b wave lasting so far 4.25 years. The second zigzag is almost complete. When it is done we should see another crash to make substantial new lows below 666.76, if the main monthly wave count is correct. If, however, the next upwards wave sees an increase in momentum beyond that seen for minor wave 3 then the alternate very bullish monthly wave count must be seriously considered. I will be watching momentum carefully over the next few weeks.
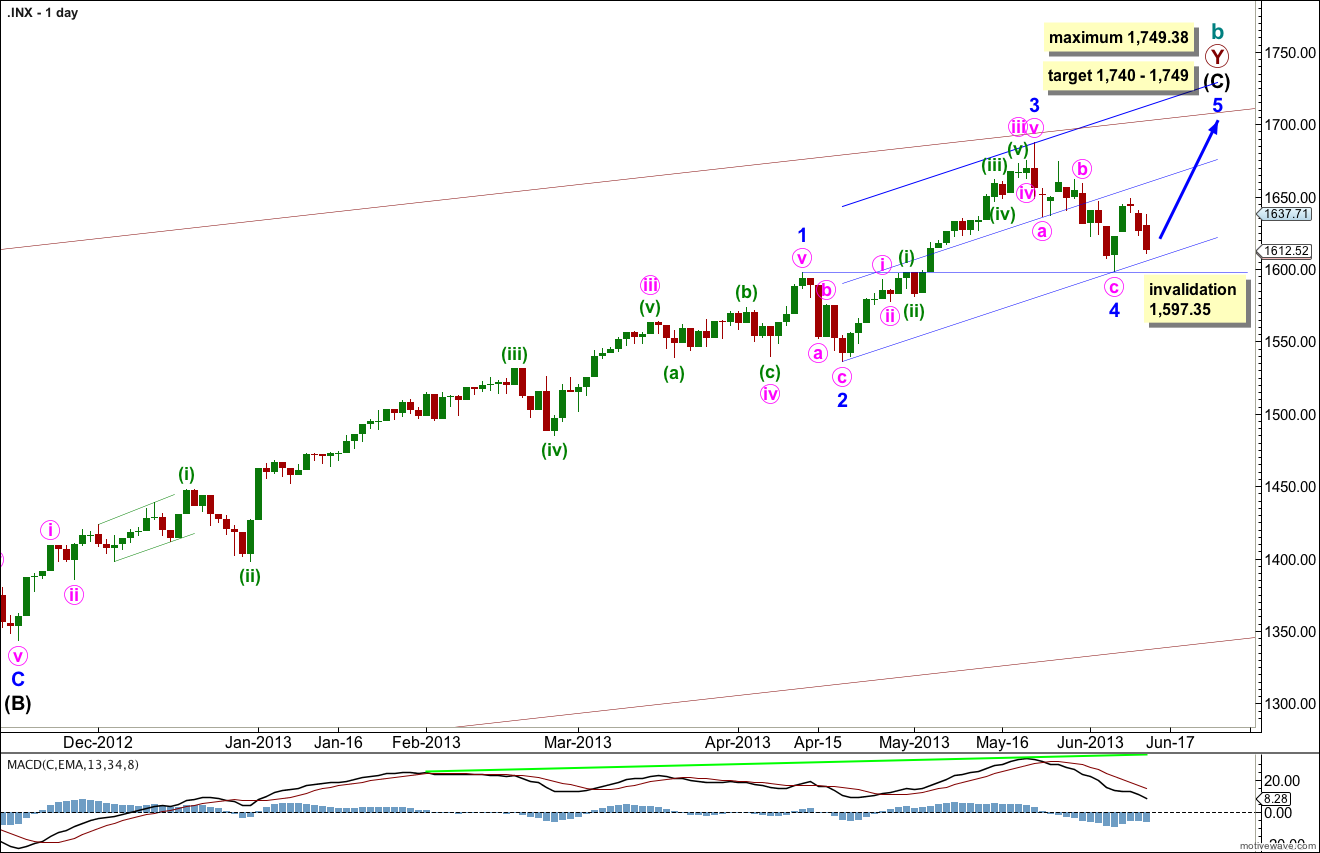
Within intermediate wave (C) minor wave 1 was extended.
Minor wave 3 is just 5.82 points short of 0.618 the length of minor wave 1. I would expect the upcoming minor wave 5 to reach equality with minor wave 3. This would be achieved at 1,749.38, and this is also a maximum point for upwards movement because minor wave 3 may not be the shortest wave.
At 1,740 intermediate wave (C) would reach equality with the orthodox length of intermediate wave (A). This gives us a 9 point target zone, and I favour the upper end of the zone because it is calculated at a lower wave degree.
If minor wave 4 were to continue any lower it may not move into minor wave 1 price territory. This wave count is invalidated with movement below 1,597.35.
Draw the channel about intermediate wave (C) using Elliott’s second technique. Draw the first trend line from the lows of minor waves 2 to 4, then place a parallel copy upon the hight of minor wave 3. Add a mid line to the channel. Expect minor wave 5 to end about the mid line, or to find resistance at the upper edge.
The very wide maroon trend channel shown here is copied over from the monthly chart. We may find this movement ends as it finds resistance at the upper trend line.
At this stage there is no divergence on the daily chart level with price trending higher and MACD also trending higher. This is an indication that the upwards trend remains in place. I would expect to see some classic technical divergence before the end of this trend.
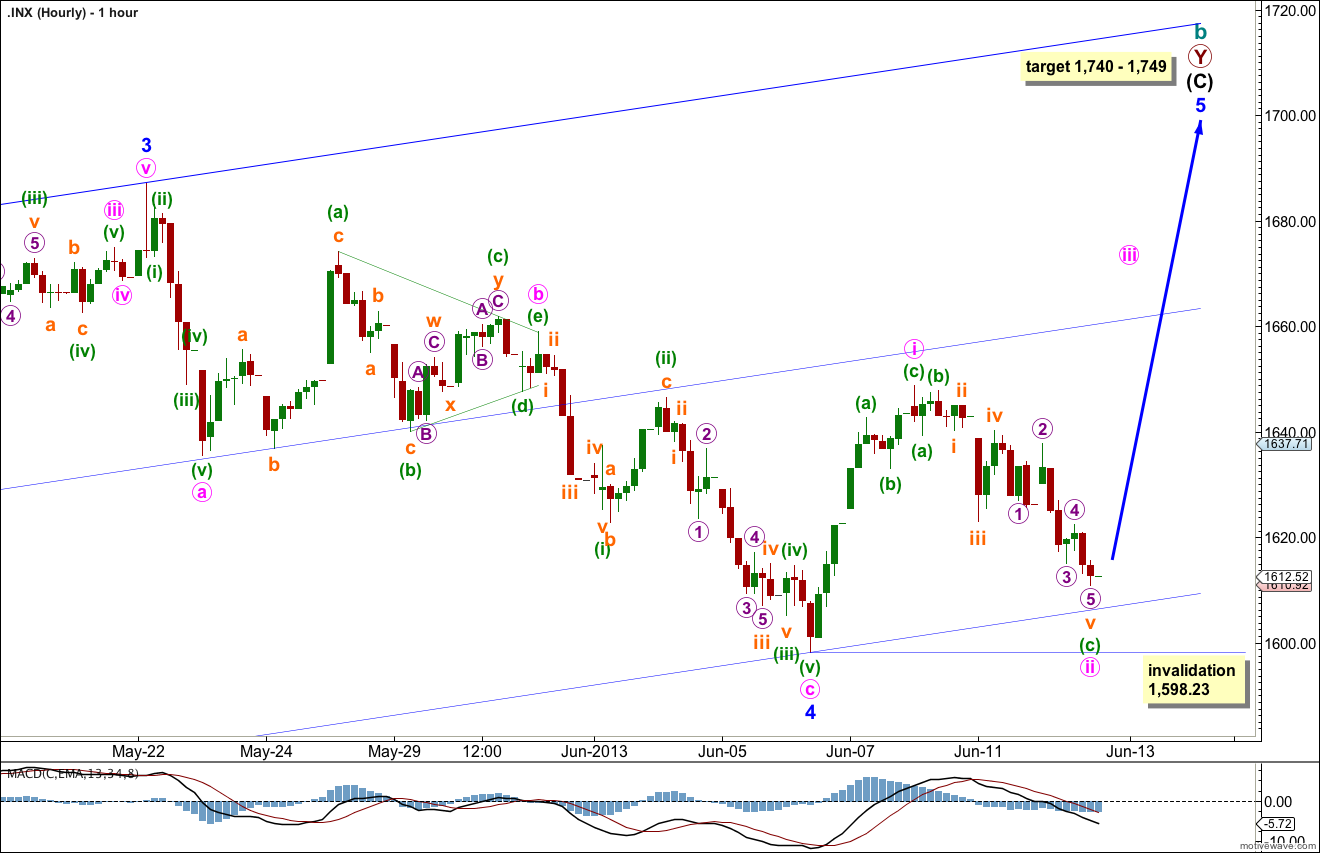
Minute wave ii has moved lower during Wednesday’s session and is now 75% of minute wave i, which is within the normal range of 66% to 81% for a second wave within a diagonal.
Although the proportions within minute wave ii do not look perfect, there are adequate Fibonacci ratios.
Minuette wave (c) is now 3.36 points short of 4.236 the length of minuette wave (a).
Ratios within minuette wave (c) are: subminuette wave iii has no Fibonacci ratio to subminuette wave i, and subminuette wave v is 2.39 short of 4.236 the length of subminuette wave i.
Ratios within the extension of subminuette wave v are: micro wave 3 is 1.39 points longer than 1.618 the length of micro wave 1, and micro wave 5 has no Fibonacci ratio to either of micro waves 3 or 1.
The structure for minute wave ii is complete, and a typical depth. It should be over here. We should see an increase in upwards momentum tomorrow for minute wave iii.
If this diagonal is ending (not leading) then minute wave iii upwards must subdivide as a zigzag.
Alternatively, if we move the degree of labeling within the upwards movement from the low labeled minor wave 4 all down one degree then we may be seeing a leading diagonal unfold for minute wave i within minor wave 5. Depending on the length and duration of the next upwards wave I may reconsider the degree of labeling for this movement in the next few days.
If minute wave ii moves any lower it may find support at the lower edge of the parallel channel containing intermediate wave (C).
Minute wave ii may not move beyond the start of minute wave i. This wave count is invalidated with movement below 1,598.23.
Now that the left shoulder is done … this push into 1750 will make the head and start our ride back down to 1591 again to make the right shoulder.
Lara,
Thanks for answering my question from yesterday in today’s video analysis. You gave a very good explanation of possibilities unfolding.
Thanks,
Rodney
You’re welcome.
It was so much easier to cover in the video rather than trying to write it out.
TBH when I calculate targets I don’t worry too much about how the structure will get it there, because along the way there will be more possibilities open up as the structure unfolds. At the beginning of a new movement it really is impossible to say exactly how it will unfold.
Nice drop … Sep. Futures low last week 1591 // we get close to 1594 time to go long again