
Last analysis expected upwards movement to begin the new trading week, which is what has happened. Although price has not moved significantly higher MACD shows a small increase in upwards momentum which is also what we expected to see.
The wave count remains the same. I have the same main hourly wave count and a new alternate hourly wave count for you today. We may use confirmation / invalidation points to work with these two wave counts tomorrow.
Click on the charts below to enlarge.
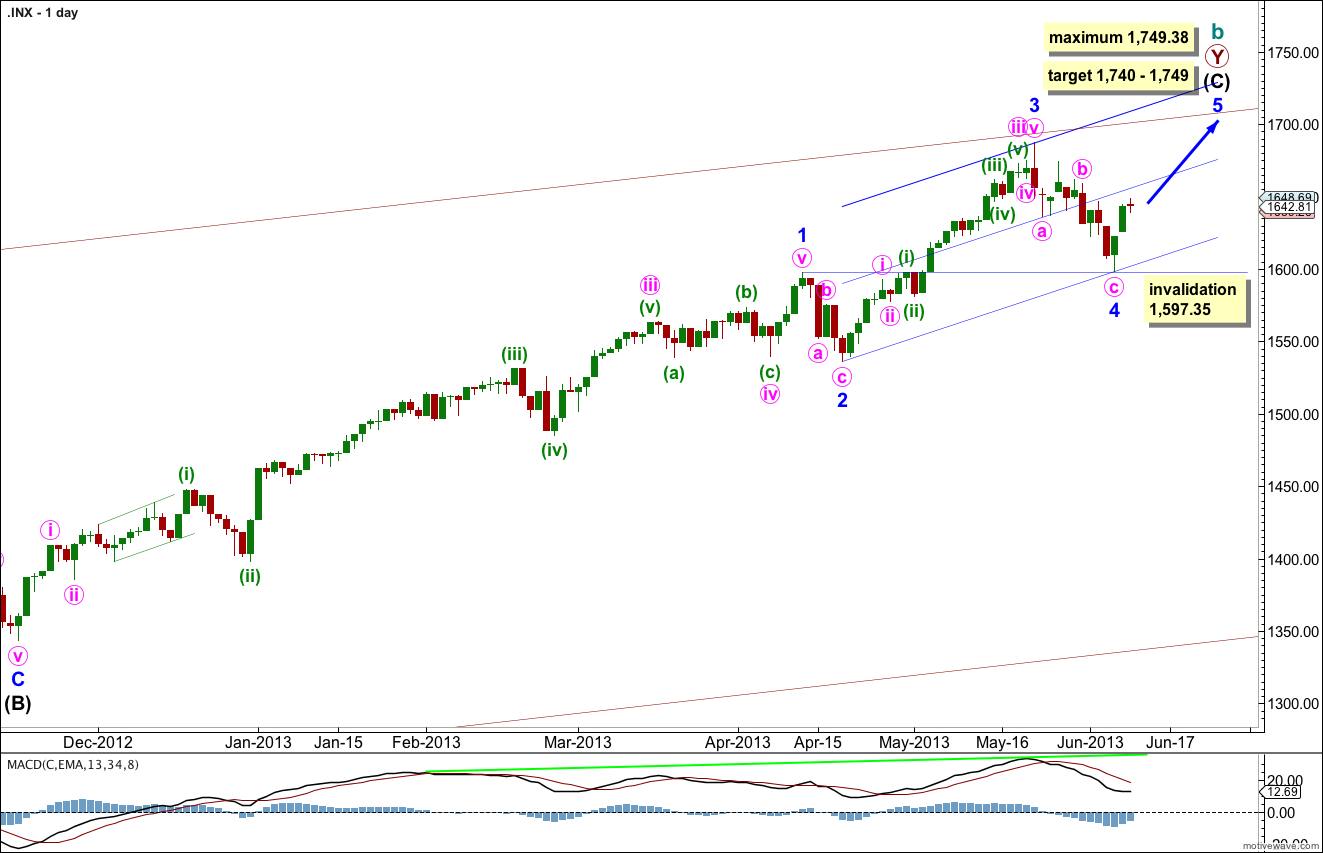
The bigger picture sees upwards movement from the end of the “credit crunch” at 666.76 as a double zigzag structure for a cycle degree b wave lasting so far 4.25 years. The second zigzag is almost complete. When it is done we should see another crash to make substantial new lows below 666.76, if the main monthly wave count is correct. If, however, the next upwards wave sees an increase in momentum beyond that seen for minor wave 3 then the alternate very bullish monthly wave count must be seriously considered. I will be watching momentum carefully over the next few weeks.
Within intermediate wave (C) minor wave 1 was extended.
Minor wave 3 is just 5.82 points short of 0.618 the length of minor wave 1. I would expect the upcoming minor wave 5 to reach equality with minor wave 3. This would be achieved at 1,749.38, and this is also a maximum point for upwards movement because minor wave 3 may not be the shortest wave.
At 1,740 intermediate wave (C) would reach equality with the orthodox length of intermediate wave (A). This gives us a 9 point target zone, and I favour the upper end of the zone because it is calculated at a lower wave degree.
If minor wave 4 were to continue any lower it may not move into minor wave 1 price territory. This wave count is invalidated with movement below 1,597.35.
Draw the channel about intermediate wave (C) using Elliott’s second technique. Draw the first trend line from the lows of minor waves 2 to 4, then place a parallel copy upon the hight of minor wave 3. Add a mid line to the channel. Expect minor wave 5 to end about the mid line, or to find resistance at the upper edge.
The very wide maroon trend channel shown here is copied over from the monthly chart. We may find this movement ends as it finds resistance at the upper trend line.
At this stage there is no divergence on the daily chart level with price trending higher and MACD also trending higher. This is an indication that the upwards trend remains in place. I would expect to see some classic technical divergence before the end of this trend.
Main Hourly Wave Count.
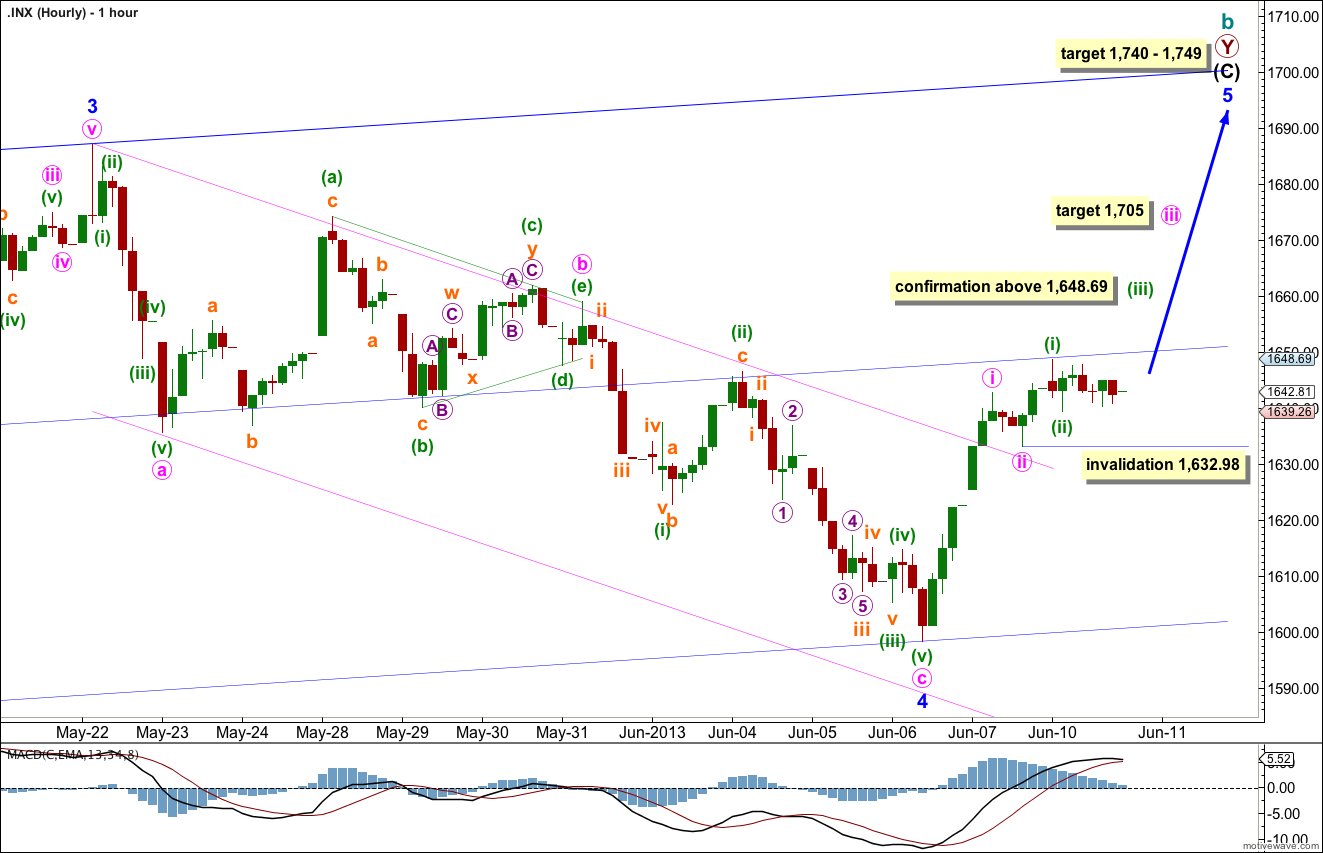
This main wave count sees minor wave 5 unfolding as an impulse. This is most likely.
It looks like minute wave ii is most likely over as a very brief and shallow zigzag. Upwards movement for Monday’s session shows a continuing increase in momentum as indicated by MACD, and so far this has the look of a third wave beginning.
If momentum continues to increase over the next couple of days this wave count would be correct. We may consider it confirmed tomorrow if price moves above 1,648.69 as at that stage the alternate below would be invalidated and the rule requiring minuette wave (iii) to move beyond the end of minuette wave (i) would be met.
When third waves unfold it is very typical (of the S&P 500 and Dow) for their subdivisions to be clearly seen. I would expect minute wave iii to show the subdivisions within it for minuette waves (ii) and (iv) clearly on the hourly chart, and so far this looks typical.
At 1,705 minute wave iii would reach 1.618 the length of minute wave i.
Within minute wave iii minuette wave (ii) may not move beyond the start of minuette wave (i). This wave count is invalidated with movement below 1,632.98.
If this wave count is invalidated with downwards movement I would expect it may be minute wave ii moving lower. That would leave minute wave i as a zigzag which could indicate an ending diagonal unfolding for minor wave 5. This is a viable alternate and so it is presented below.
Alternate Hourly Wave Count.
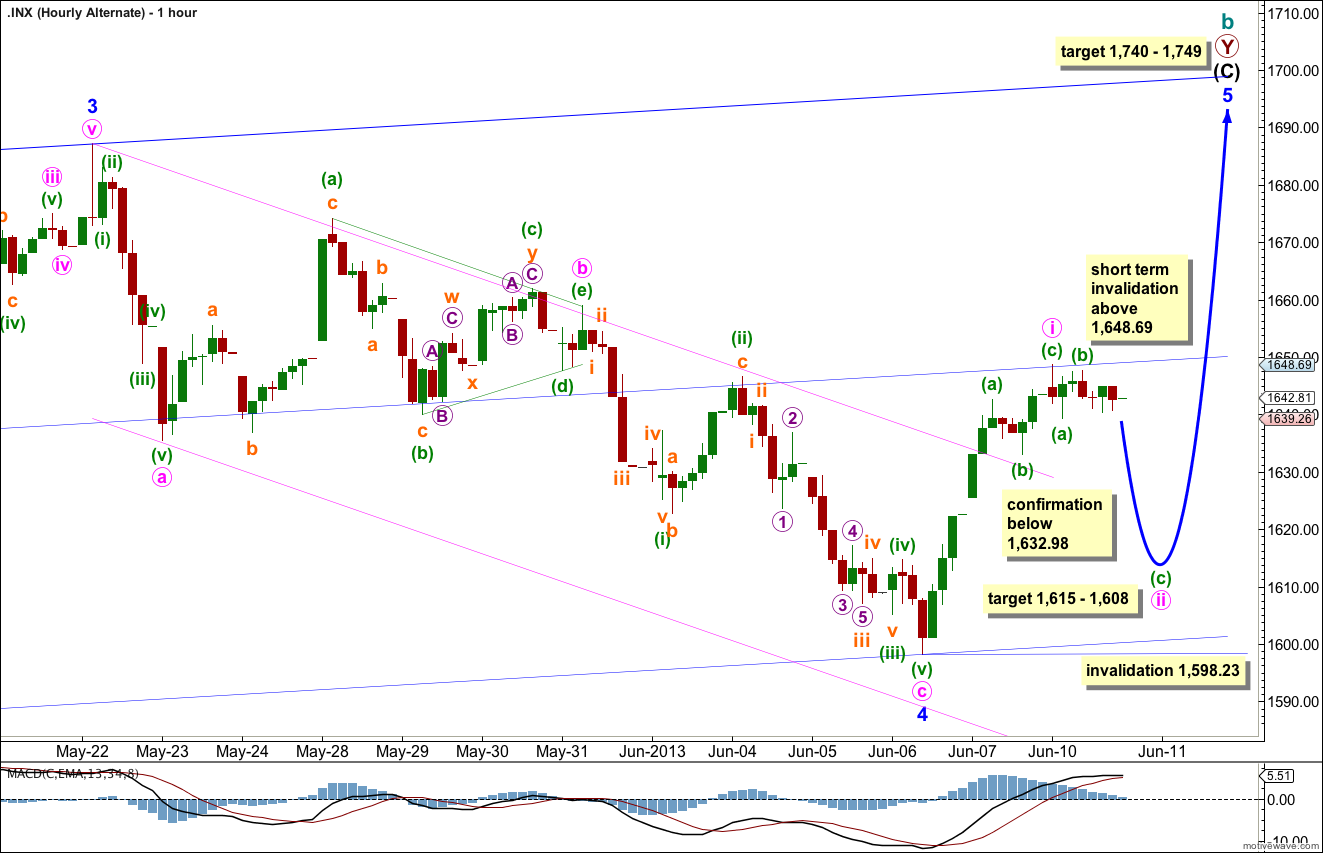
This alternate wave count sees minor wave 5 unfolding as an ending diagonal. This is less likely than the main wave count, but it still has a reasonable probability and so we must consider it.
This scenario would be confirmed if price moves below 1,632.98 tomorrow.
Ending diagonals require all the subwaves to subdivide into zigzags. So far minute wave i may be complete as a zigzag. Minute wave ii may have begun.
Within diagonals the second and fourth waves normally correct to between 0.66 to 0.81 of the prior wave. This gives us a target zone for more downwards movement to between 1,615 to 1,608.
Minute wave ii must subdivide as a single zigzag. Within the zigzag minuette wave (b) may not move beyond the start of minuette wave (a). This wave count is invalidated with movement above 1,648.69 (in the short term, before minute wave ii downwards is complete).
Minute wave ii may not move beyond the start of minute wave i. This wave count is invalidated with movement below 1,598.23.