
Yesterday’s analysis expected some more downwards movement to be slight and overlapping. This is what we have seen, and price has come very close to the invalidation point as we expected it to do, before turning away.
The wave count remains the same with just the one daily and one hourly chart for you.
Click on the charts below to enlarge.
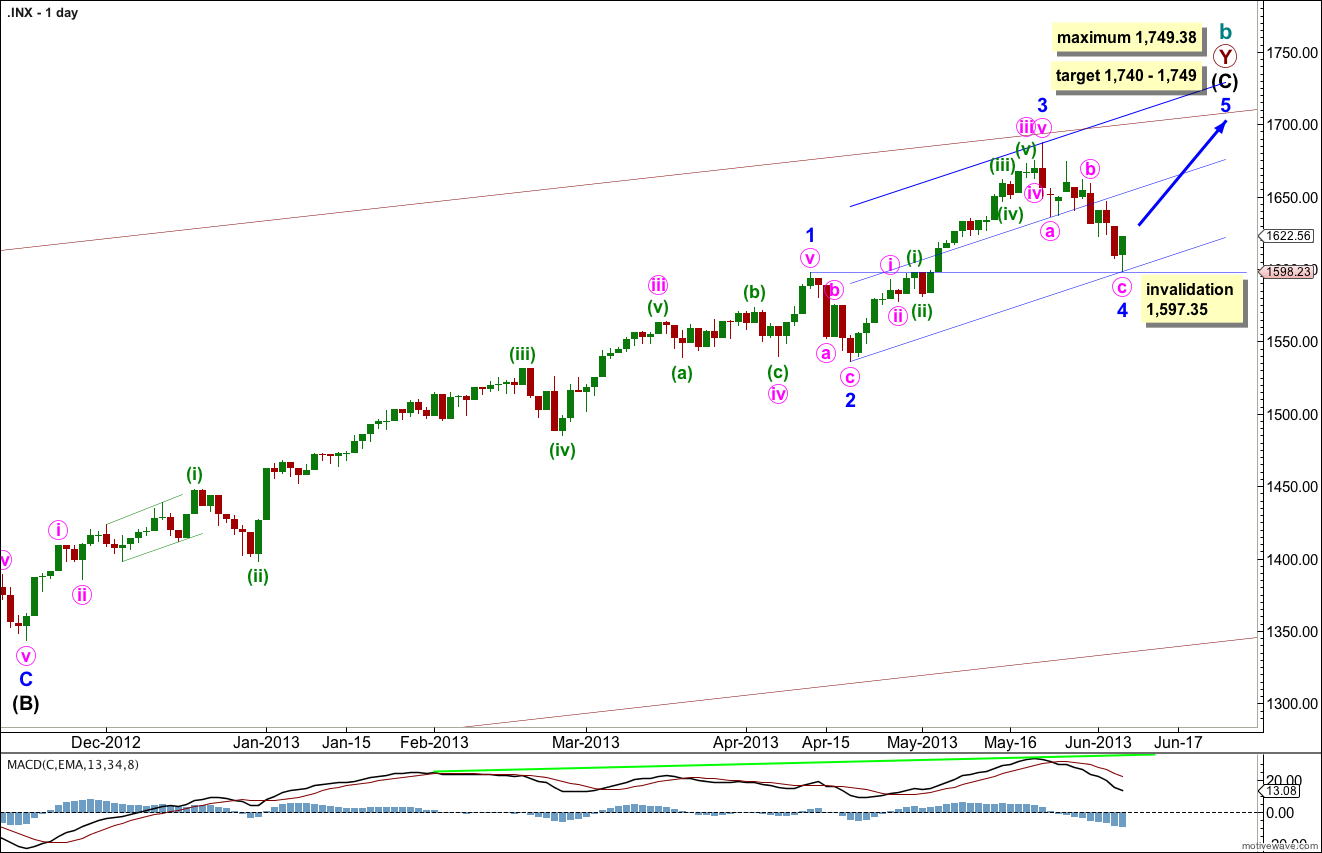
The bigger picture sees upwards movement from the end of the “credit crunch” at 666.76 as a double zigzag structure for a cycle degree b wave lasting so far 4.25 years. The second zigzag is almost complete. When it is done we should see another crash to make substantial new lows below 666.76, if the main monthly wave count is correct. If, however, the next upwards wave sees an increase in momentum beyond that seen for minor wave 3 then the alternate very bullish monthly wave count must be seriously considered. I will be watching momentum carefully over the next few weeks.
Within intermediate wave (C) minor wave 1 was extended.
Minor wave 3 is just 5.82 points short of 0.618 the length of minor wave 1. I would expect the upcoming minor wave 5 to reach equality with minor wave 3. This would be achieved at 1,749.38, and this is also a maximum point for upwards movement because minor wave 3 may not be the shortest wave.
At 1,740 intermediate wave (C) would reach equality with the orthodox length of intermediate wave (A). This gives us a 9 point target zone, and I favour the upper end of the zone because it is calculated at a lower wave degree.
I have checked the subdivisions within minor wave 3 on the hourly chart. Although the middle of it looks a little odd on the daily chart it does have a nice fit on the hourly chart. I have tried to see an alternative fit that looks better on the daily chart, but minute waves iii and iv must be placed where they are here.
Minor wave 4 may have just completed as a single zigzag with minute wave b within it a triangle.
If it were to continue any lower, minor wave 4 may not move into minor wave 1 price territory. This wave count is invalidated with movement below 1,597.35.
I have redrawn the channel using Elliott’s second technique now that the fourth wave is likely to be complete. Draw the first trend line from the lows of minor waves 2 to 4, then place a parallel copy upon the hight of minor wave 3. Expect minor wave 5 to end about midway within this channel, or to find resistance at the upper edge.
The very wide maroon trend channel shown here is copied over from the monthly chart. We may find this movement ends as it finds resistance at the upper trend line.
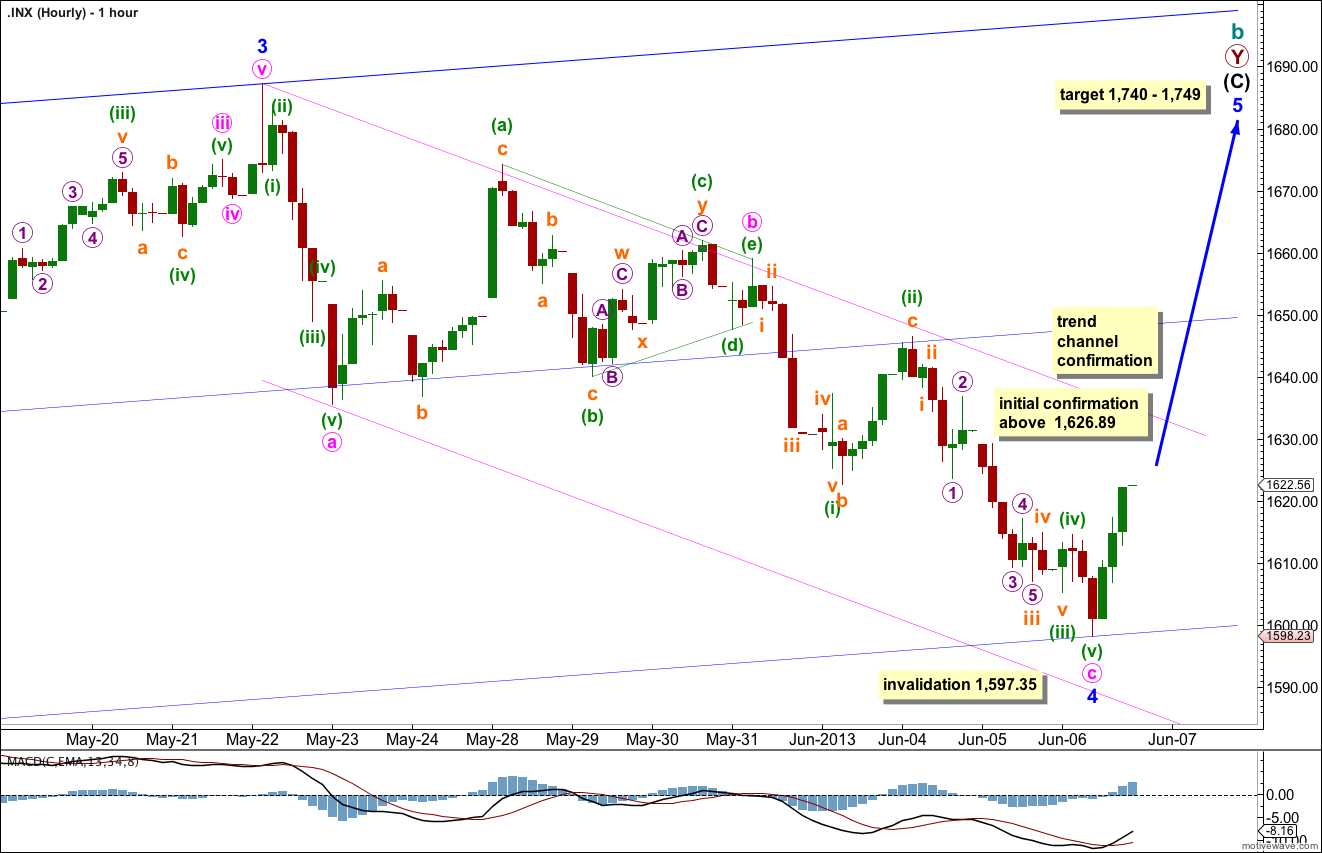
The zigzag structure of minor wave 4 may now be complete. There is no Fibonacci ratio between minute waves a and c.
Ratios within minute wave c are: there is no Fibonacci ratio between minuette waves (iii) and (i), and minuette wave (v) is just 0.62 longer than 0.382 the length of minuette wave (iii).
On the five minute chart minuette waves (iii), (iv) and (v) look complete, but because a truncation is involved for the end of minuette wave (iii) I must allow for the possibility that upwards movement to end Thursday’s session could be minuette wave (iv) and minuette wave (v) downwards may follow it.
The end of minuette wave (i) (from the five minute chart) is at 1,626.89. If we see price movement above this point then upwards movement cannot be minuette wave (iv) and so at that stage minute wave c must be over. This would provide some confidence that minor wave 4 in its entirety should be over.
Further confirmation that the upwards trend has resumed would come with a very clear trend channel breach of the pink channel containing the downwards correction of minor wave 4. At that stage we may have confidence that price should make new highs and should continue upwards for probably another three weeks towards the target.
Any further downwards movement of minor wave 4 may not move into minor wave 1 price territory. This wave count is invalidated with movement below 1,597.35.
Could yesterday be the bottom of wave A and now that we are back up at the channel line wave B … and now about 100 points down for Wave C of [4] ?
Technically… yes its possible.
But there is almost no room for movement now for minor wave 4. And if it is over now it is already longer in duration than minor wave 2, if it were to continue further it would start to be out of proportion.
It is the proportion of the corrective waves within an impulsive structure (waves 2 and 4) which give a wave count the “right look”.
At the moment they have the “right look”.
It is highly unlikely we shall see further movement for minor wave 4.
When we have a clear five upwards on the hourly chart this would be strongly confirmed.
When we go under 1597.35 are you going to call the market top?
No.