
Last analysis expected more choppy overlapping movement. The hourly wave count expected price to move lower during Wednesday’s session as a corrective structure unfolded downwards. This is exactly what has happened.
There is enough of this structure completed now to be able to calculate a target for it to end, and to draw channels about recent movement to use as indicators of when it is over.
The wave count remains the same with just the one daily and one hourly wave count.
Click on the charts below to enlarge.
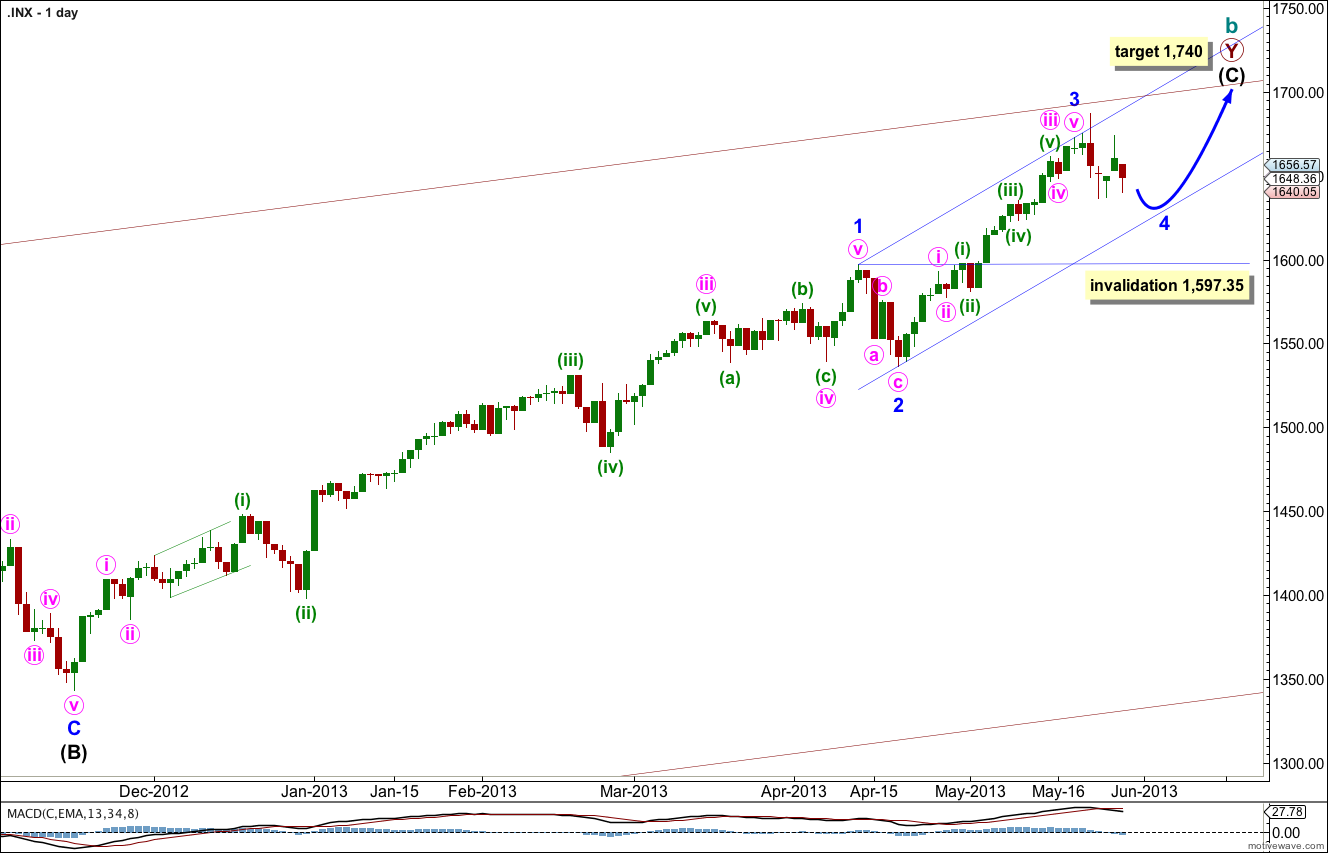
Within intermediate wave (C) minor wave 1 was extended.
Minor wave 3 is now complete. There is no Fibonacci ratio between minor waves 3 and 1. This means it is highly likely we should see a Fibonacci ratio between minor wave 5 and either of 3 or 1.
Minor wave 3 is shorter than minor wave 1. Minor wave 5 would be limited to no longer than equality with minor wave 3 because a third wave may never be the shortest.
At 1,740 intermediate wave (C) would reach equality with the orthodox length of intermediate wave (A). When minor waves 3 and 4 within intermediate wave (C) are complete I will use calculations at minor degree to add to this target so it may change or widen to a zone.
Minor wave 4 may not move into minor wave 1 price territory. This wave count is invalidated with movement below 1,597.35.
Draw the parallel channel about intermediate wave (C) using Elliott’s first technique. Draw the first trend line from the highs of minor waves 1 to 3, then place a parallel copy upon the low of minor wave 2. Expect minor wave 4 to find support at the lower edge of this channel. The following fifth wave may end midway in the channel where it intersects with the upper maroon trend line.
The very wide maroon trend channel shown here is copied over from the monthly chart. We may find this movement ends as it finds resistance at the upper trend line.
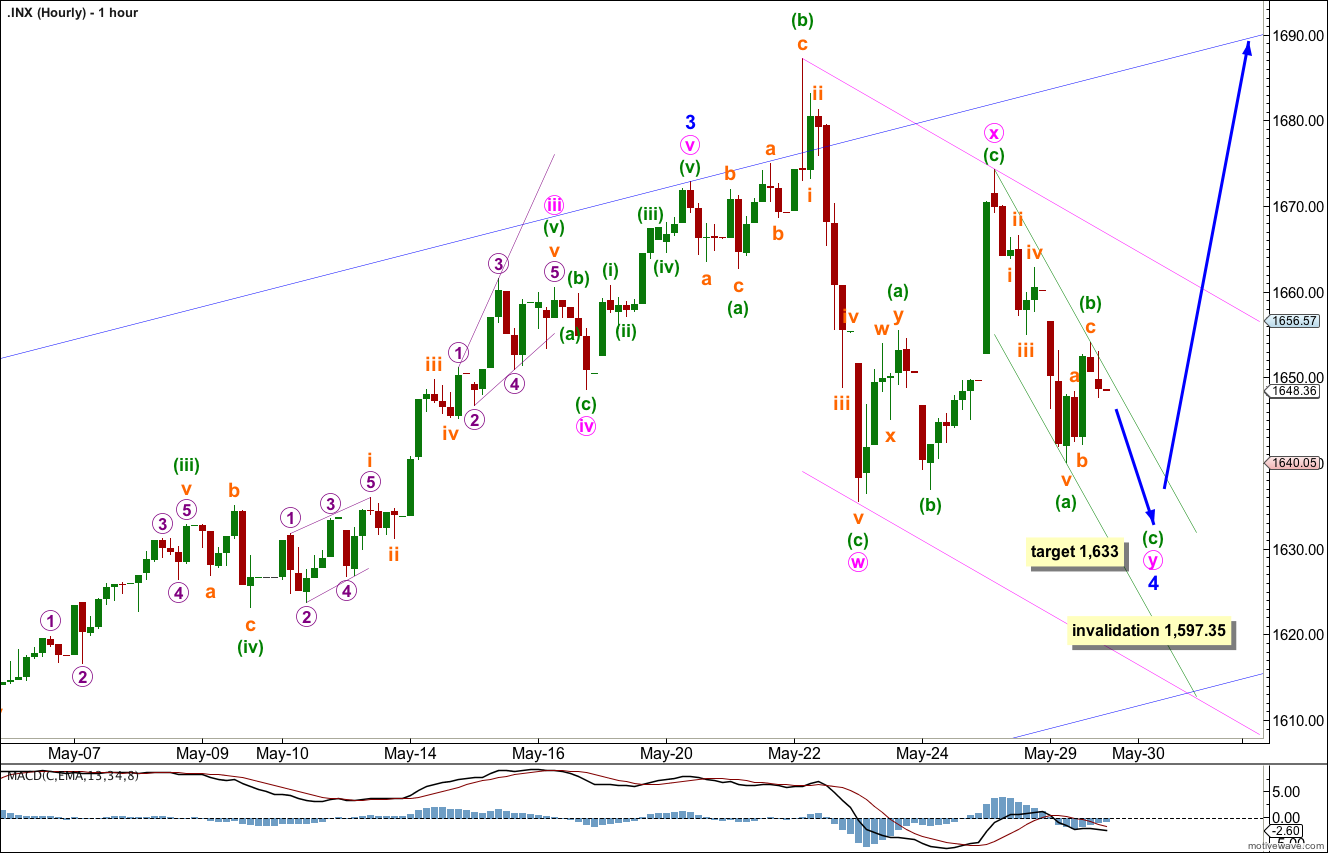
Price has moved lower for the session as expected and looks like it is unfolding as a 5-3-5 zigzag structure. Minor wave 4 may be unfolding as a double combination: flat-x-zigzag.
Within minute wave y, the second structure in the double, minuette wave (a) subdivides into a five wave impulse. Minuette wave (b) subdivides into a three wave zigzag.
Ratios within minuette wave (a) are: subminuette wave iii has no Fibonacci ratio to subminuette wave i, and subminuette wave v is 1.85 points short of 2.618 the length of subminuette wave i.
Within minuette wave (b) there is no Fibonacci ratio between subminuette waves a and c.
At 1,633 minuette wave (c) would reach 0.618 the length of minuette wave (a), and minute wave y would end about the same level as minute wave w achieving the purpose of a combination to move price sideways.
This structure may be complete in one more session.
Draw a parallel channel using Elliott’s technique about the zigzag of minute wave y. When we see clear strong upwards movement above this channel we shall have trend channel confirmation that the zigzag of minute wave y is over and the next movement upwards is underway.
At that stage there will be a slim outlying possibility that minute wave y may be incomplete and may continue further as a triangle or a large flat correction. This has a low probability mostly because it would see minor wave 4 even longer in duration to minor wave 2 and becoming out of proportion. Some variation is acceptable, but the overall look has to be right which means they should be reasonably similar in duration. I will consider this possibility if it shows itself to be correct.
If the first upwards movement following the completion of minute wave y is a five then we shall have strong confirmation that minor wave 4 is over. If the first upwards movement following the completion of minute wave y is a three then we shall have to consider the possibility that minor wave 4 is incomplete.
Minor wave 4 may not move into minor wave 1 price territory. This wave count is invalidated with movement below 1,597.35.
Not looking to go over May’s highs soon … with the NYMO -62.34% that low have to look for a bounce again http://scharts.co/15eNr62
Looks like a symmetrical Triangles and they have a tendency to double bust – so we can go sideways for a long-time yet. // to keep dropping like your count shows would seem to me a bit simplistic.
OUR end goal is the same 1750 area.
Except so far the subdivisions do not fit for a triangle.
A triangle must subdivide 3-3-3-3-3, and so far we have two 5’s in there. It does not work.