
Last week’s analysis expected oil to move lower which is what has happened. The channel about the last upwards wave on the daily chart is now breached providing trend channel confirmation of a trend change back to the downside for oil.
Click on the charts below to enlarge.
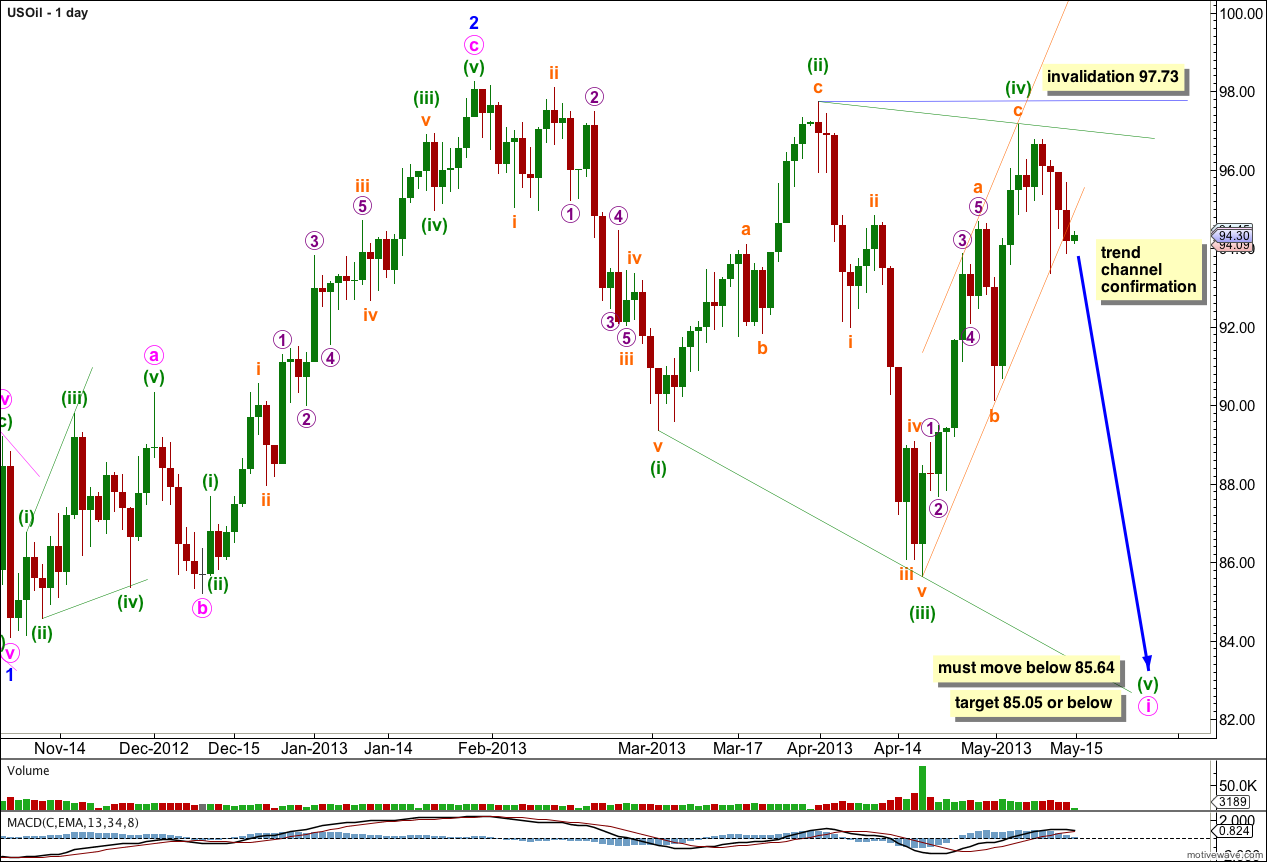
This wave count sees US Oil in a third wave downwards at intermediate degree, within a primary wave C down.
Within intermediate wave (3) minor waves 1 and 2 are complete.
Within minor wave 3 minute wave i may be unfolding as a leading diagonal. Within the leading diagonal minuette waves (ii) and (iv) must subdivide into zigzags, and minuette waves (i), (iii), and (v) are usually zigzags but may also subdivide as impulses. Second and fourth waves of diagonals are usually deep corrections, between 66% to 81%. Minuette wave (ii) is deeper at 94% and minuette wave (iv) is now 95%.
We now have a clear breach of the parallel channel containing the zigzag of minuette wave (iv) indicating this correction is over and the next wave down has begun.
Within the leading diagonal minuette wave (v) may not be truncated, it must move below 85.64.
The diagonal is expanding. We should expect minuette wave (v) to be longer than minuette wave (iii), to move below 85.05. However, I have seen diagonals where the third wave is still the longest, so this may not happen.
Draw a parallel channel about minuette wave (iv) using Elliott’s channeling technique. Draw the first trend line from the start of minuette wave (iv) to the low of subminuette wave b within it, then place a parallel copy upon the high of subminuette wave a within minuette wave (iv). We have seen this parallel channel clearly breached by downwards movement and now have confidence the correction is over and a fifth wave down has begun.
Minuette wave (iv) of the diagonal should overlap into minuette wave (i) price territory, but may not move beyond the start of minuette wave (ii) price territory. This wave count is invalidated with movement above 97.73
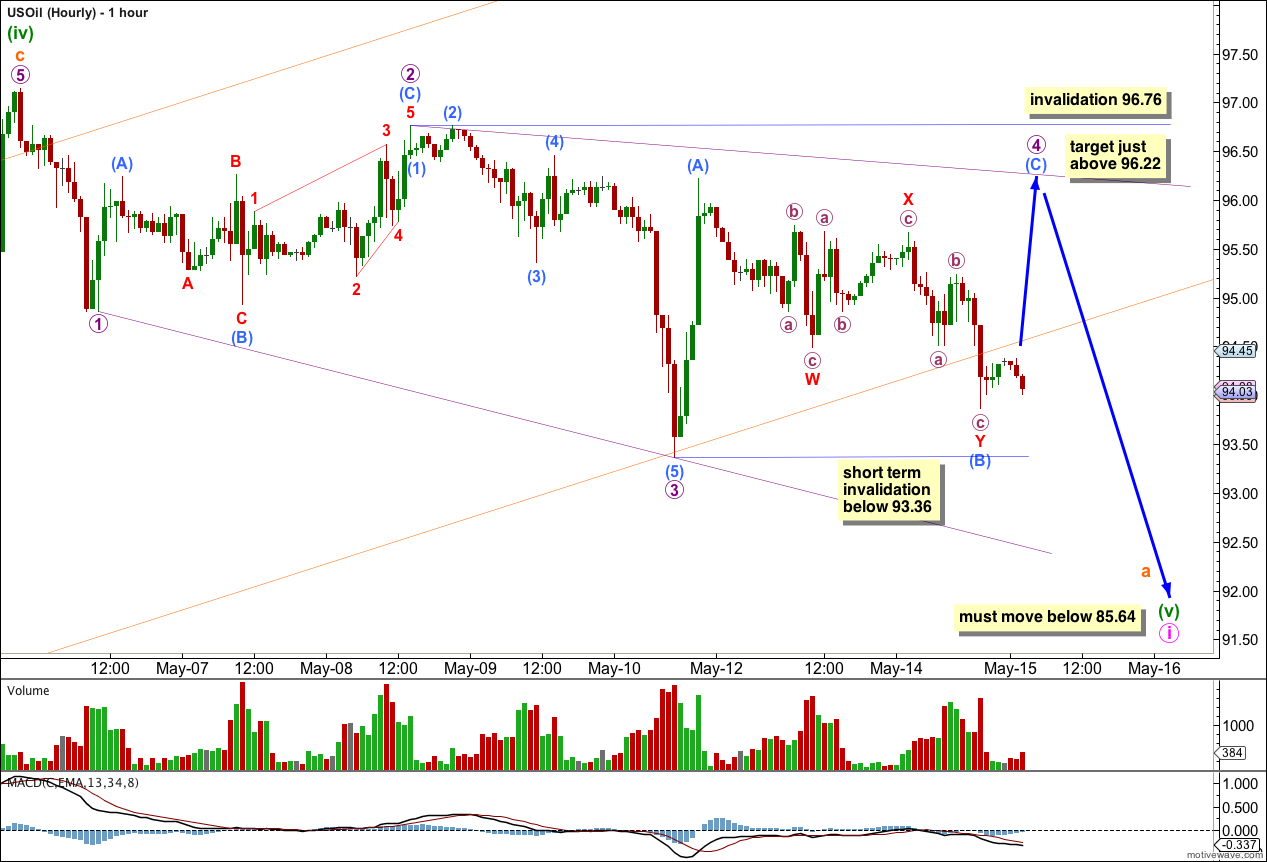
Since last analysis price has moved lower. The channel breach indicates a new wave down has begun which must subdivide into either a zigzag or an impulse. If it subdivides into a zigzag (most likely) then subminuette wave a within it must subdivide into a five wave structure, either a leading diagonal or an impulse.
I have considered various possibilities for movement downwards from the high at 97.14 labeled minuette wave (iv). The key seems to be the upwards movement labeled submicro wave (A) within micro wave 4. On the five minute chart this movement subdivides perfectly as a five wave impulse and it is not possible to see it as a zigzag. The correction cannot have ended there and so must move higher.
Within micro wave 4 submicro wave (B) subdivides nicely into a double zigzag. If this structure moves any lower, or continues further sideways, it may not move beyond the start of submicro wave (A) within the zigzag. This wave count is invalidated in the short term (prior to a five up for submicro wave (C) being complete) with movement below 93.36.
Submicro wave (C) must subdivide into a five wave structure to complete the zigzag for micro wave 4. Submicro wave (C) is very likely to end above the end of submicro wave (A) to avoid a truncation above 96.22.
Within the diagonal micro wave 4 should overlap into micro wave 1 price territory, but may not move beyond the end of micro wave 2. This wave count is invalidated with movement above 96.76.
The other possibility which may be unfolding to the downside would be an impulse. It too would require the completion of a zigzag with subdivisions labeled essentially the same as micro wave 4 here. The short term outlook would be the same.
When the zigzag of micro wave 4 is completed, if this wave count remains valid, then we should expect a fifth wave downwards which must make a new low below the end of micro wave 3 at 93.36 because the fifth wave of a leading diagonal may not be truncated.