
Yesterday’s analysis expected more upwards movement from the S&P 500 which is what happened. Price is now very close to the short term target. Price found resistance at the upper edge of the parallel channel on the hourly chart during Wednesday’s session. It may do the same tomorrow.
The wave count remains the same.
Click on the charts below to enlarge.
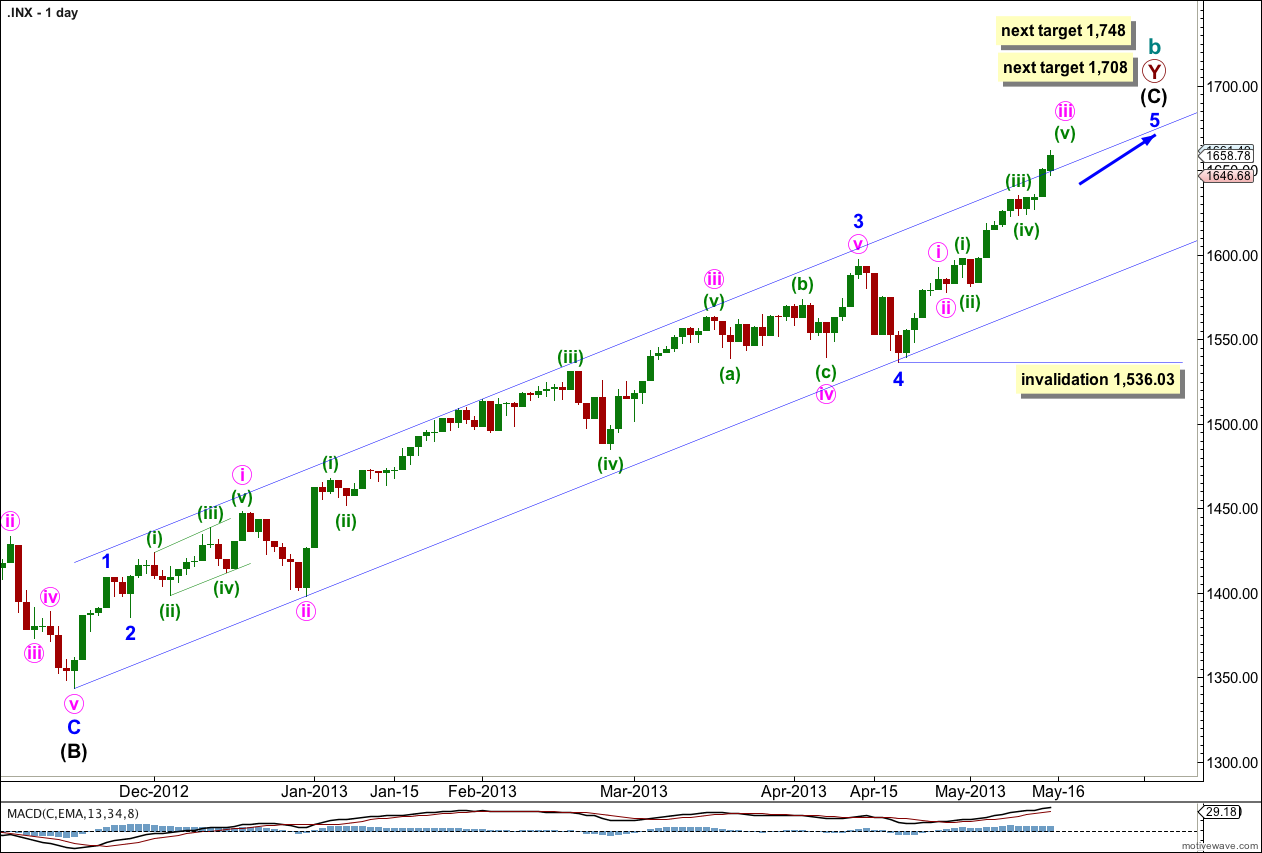
This trend is not over and price should continue to move higher for maybe about another few weeks.
Draw a channel about intermediate wave (C) here on the daily chart. Draw the first trend line from the start of intermediate wave (C) to the low of minute wave ii within minor wave 3. Place a parallel copy to contain all this upwards movement. So far this channel shows very closely where price is finding support and resistance and should continue to do so.
The wave count within minor wave 3 fits with MACD as an indicator of momentum. The strongest piece of upwards movement within intermediate wave (C) corresponds to the middle of a third wave.
Within intermediate wave (C) minor wave 4 is over and minor wave 5 is underway. Because there is no Fibonacci ratio between minor waves 1 and 3 I would expect to see a ratio for minor wave 5.
Minor wave 5 is showing subdivisions at minute degree on the daily chart, and minute wave iii within it is also showing subdivisions on the daily chart which is very common.
Minor wave 5 has passed equality with minor wave 1 and is extending. At 1,708 minor wave 5 would reach 2.618 the length of minor wave 1. If price continues higher through this target the next possible end would be at 1,748 where minor wave 5 would reach equality in length with minor wave 3.
It would be somewhat unlikely that minor wave 5 would be longer than the extended minor wave 3.
Within minor wave 5 no second wave correction may move beyond the start of its first wave. This wave count is invalidated with movement below 1,536.03.
Within minor wave 5 minute wave iii is incomplete.
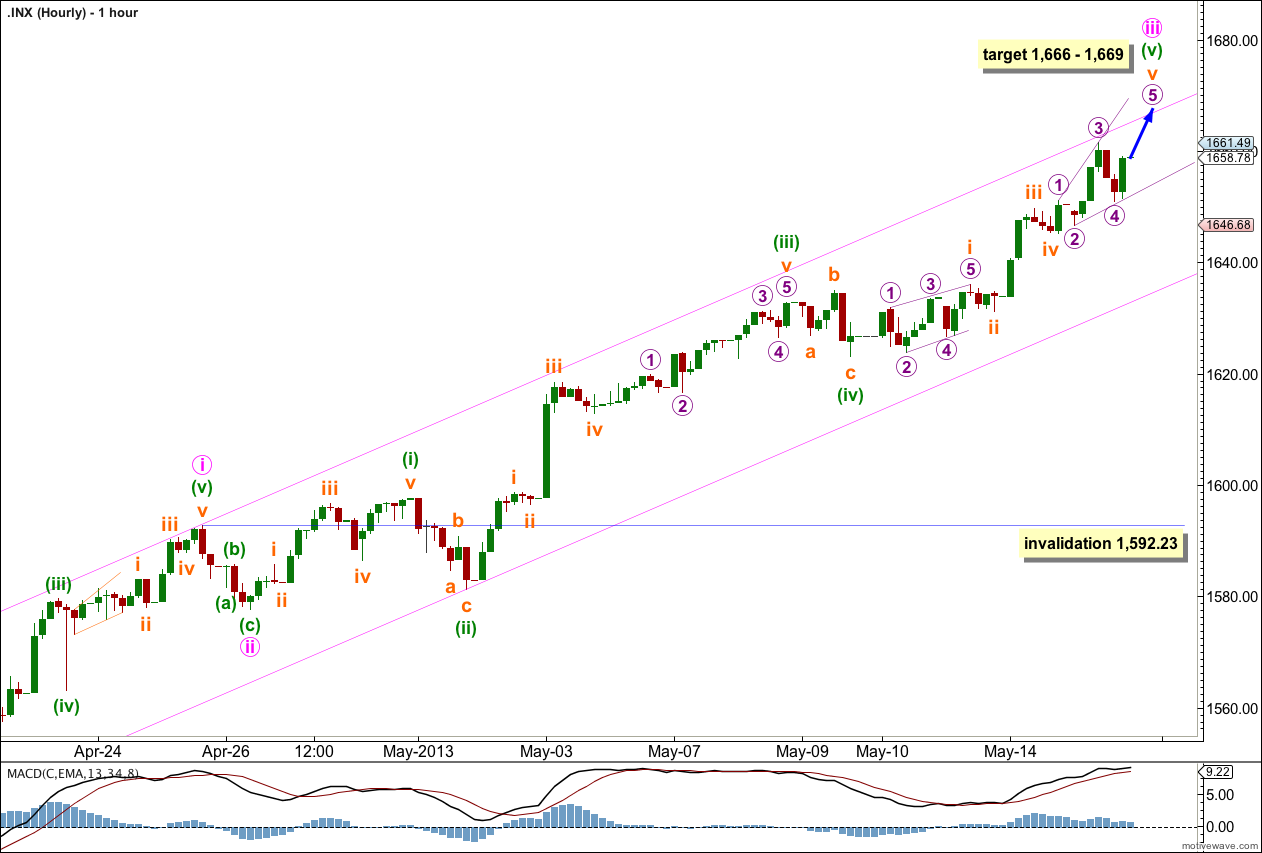
Price found resistance at the upper edge of this channel during the session. Micro wave 5 may do the same tomorrow. Draw this channel first with a trend line from the start of minor wave 5 to the low of minuette wave (ii) within minute wave iii, then place a parallel copy upon the high of minute wave i.
Wednesday’s upwards movement subdivides on the five minute chart okay as an ending diagonal; a series of overlapping zigzags trending upwards.
Subminuette wave v is unfolding as an ending expanding diagonal. I would expect micro wave 5 to be longer than micro wave 3. Micro wave 5 would reach equality with micro wave 3 at 1,666. It is likely upwards movement will end just a little above this point.
At 1,669 minute wave iii would reach 1.618 the length of minute wave i.
When this diagonal structure is complete we should expect a trend change for the short term. Minute wave iv should last between one to four days and should end within the range of the fourth wave of one lesser degree between 1,632.78 and 1,623.09.
Minute wave iv may not move into minute wave i price territory. This wave count is invalidated with movement below 1,592.23.