
Last analysis expected upwards movement for Friday’s session. Price did move slightly higher for the session, but most movement was sideways.
It is more likely now that the fourth wave correction is over and the fifth wave may have begun at the end of Friday’s session. The wave count and targets remain the same.
It is time to review the big picture on monthly charts.
Click on the charts below to enlarge.
Main Monthly Wave Count.
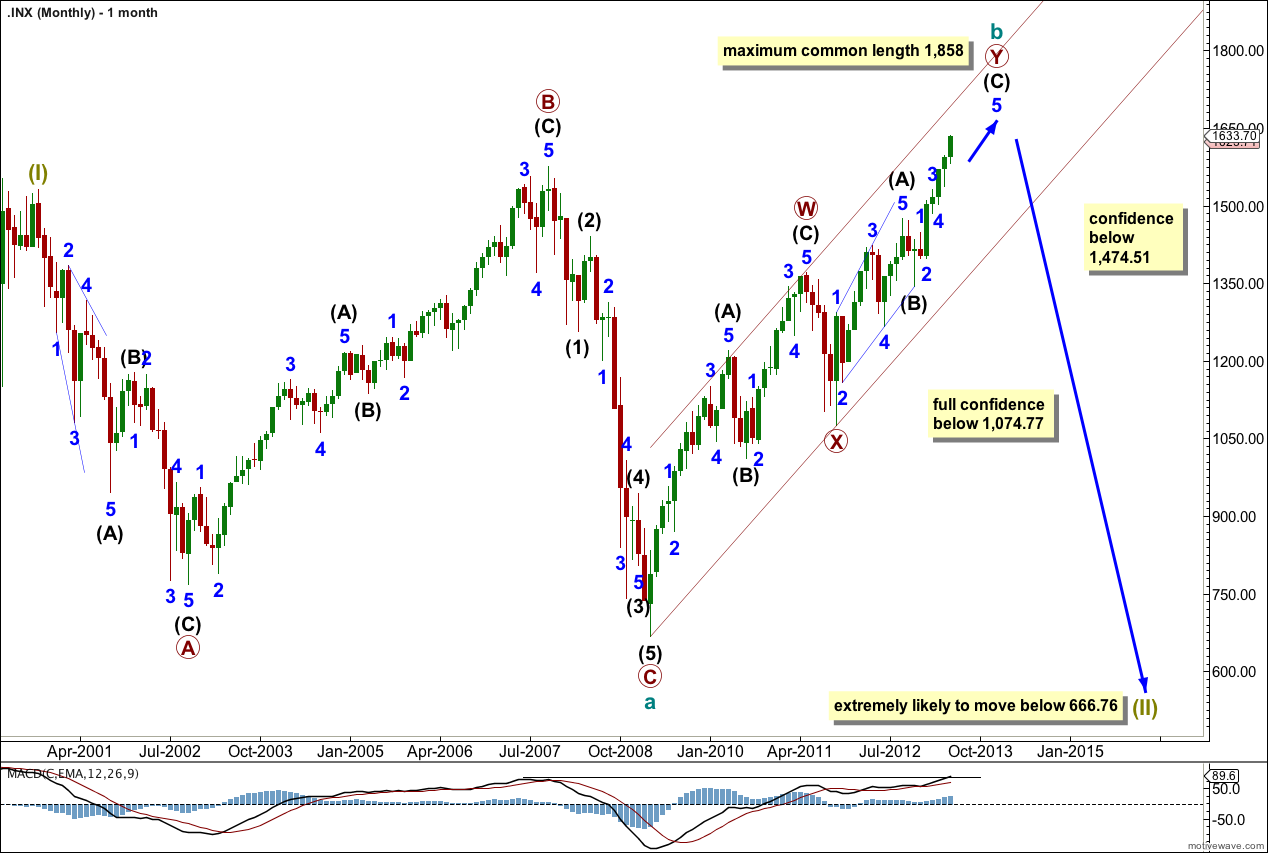
This main wave count sees the S&P 500 in a large expanded flat correction at super cycle degree. Within the correction cycle wave b upwards is nearing completion. The maximum common length of cycle wave b in relation to cycle wave a is 138%. This would be achieved at 1,858. If price moves above this point this would be my alternate wave count and I would switch to using the next chart below as my main monthly wave count.
Expanded flat corrections are very common.
The structure unfolding upwards subdivides nicely as a double zigzag which is a common structure. Within the double zigzag subwaves primary W and X are complete. The second zigzag in the double primary wave Y is nearly complete.
Movement below 1,474.51 would invalidate the alternate monthly chart below and provide confidence in this wave count. Further movement below 1,074.77 would eliminate any further alternate which could see new highs. At that stage we would be confident the market should keep going lower, and would be extremely likely to move below 666.79.
Expanded flat corrections normally have C waves which move substantially beyond the end of the A wave. We would expect cycle wave c to move substantially below 666.76.
Alternate Monthly Wave Count.
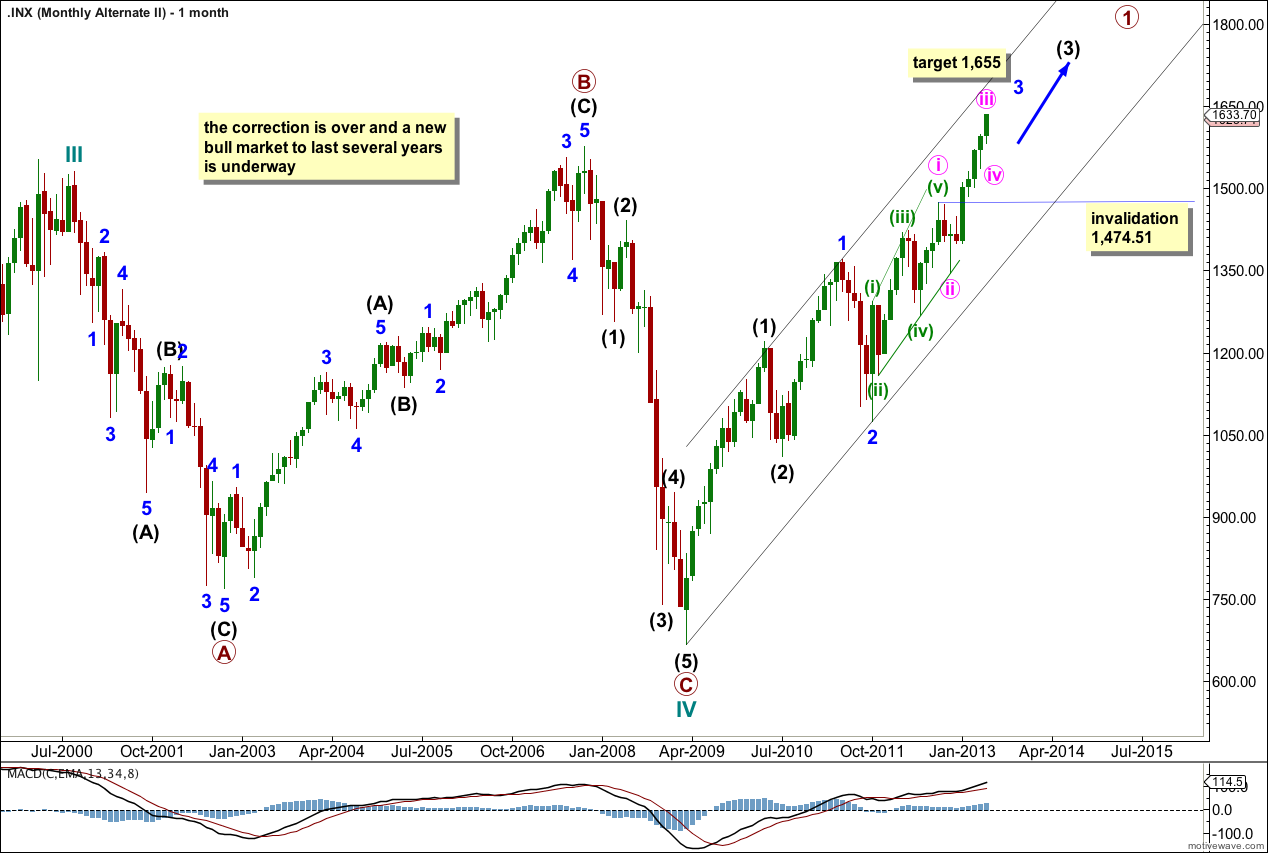
Alternatively, it is just possible that we may be in a new bull market to last several years. At this stage this wave count does not fit with social mood though as it is too optimistic. However, the structure fits and with a recent increase in momentum seen via MACD on the monthly chart it may be that we are entering the middle of a third wave upwards. There is now no divergence between price trending higher and MACD as it too now trends higher.
Although a series of overlapping first and second waves at the start of an impulse is very common, this wave count so far has an odd look. The proportion of minor wave 2 to intermediate wave (2) does not look right. Also, if the diagonal labeled here minute wave i is a leading diagonal in a first wave position then it would most likely have been followed by a very deep second wave correction, but minute wave ii is only a 32.8% correction of minute wave i.
At 1,655 minor wave 3 would reach 1.618 the length of minor wave 1. Within minor wave 3 minute wave iv may not move into minute wave i price territory. This wave count is invalidated with movement below 1,474.51.
Daily Wave Count – Main.
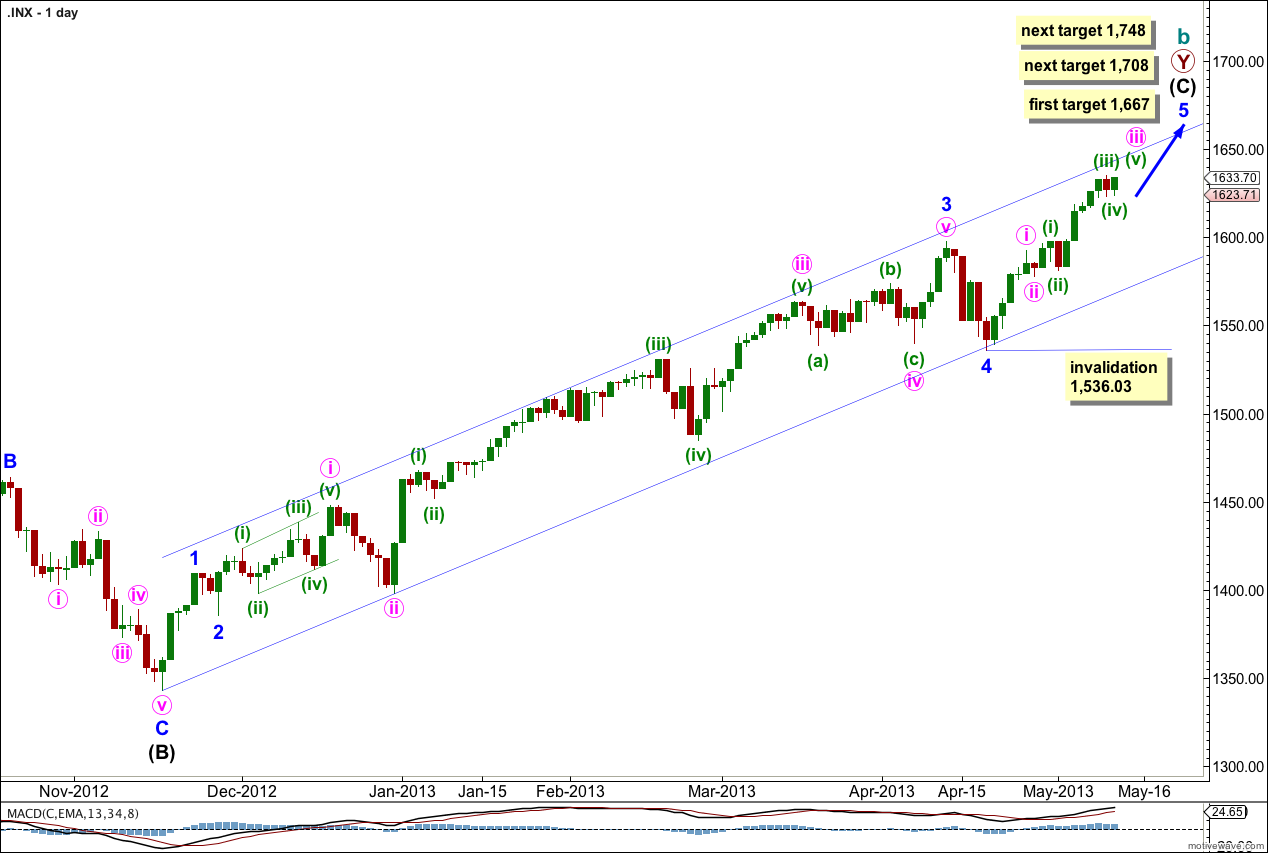
This trend is not over and price should continue to move higher for maybe about another few weeks. I have adjusted the wave count within minor wave 5 to have a better fit and look on the daily chart. It is extremely common (we should expect it) to see subdivisions of minute degree third waves on the daily chart. The recent fourth wave correction may have been minute degree and not minor degree. We still have another fourth wave correction to come.
Draw a channel about intermediate wave (C) here on the daily chart. Draw the first trend line from the start of intermediate wave (C) to the low of minute wave ii within minor wave 3. Place a parallel copy to contain all this upwards movement. So far this channel shows very closely where price is finding support and resistance and should continue to do so.
The wave count within minor wave 3 fits with MACD as an indicator of momentum. The strongest piece of upwards movement within intermediate wave (C) corresponds to the middle of a third wave.
Within intermediate wave (C) minor wave 4 is over and minor wave 5 is underway. Because there is no Fibonacci ratio between minor waves 1 and 3 I would expect to see a ratio for minor wave 5.
Minor wave 5 has passed equality with minor wave 1 and is extending. At 1,667 (which now looks unlikely) minor wave 5 would reach 0.618 the length of minor wave 3. If price keeps rising through this first target, or if when it gets there the structure is incomplete, then the next target is at 1,708 where minor wave 5 would reach 2.618 the length of minor wave 1. Again, if price continues higher through this target the next possible end would be at 1,748 where minor wave 5 would reach equality in length with minor wave 3.
It would be somewhat unlikely that minor wave 5 would be longer than the extended minor wave 3.
Within minor wave 5 no second wave correction may move beyond the start of its first wave. This wave count is invalidated with movement below 1,536.03.
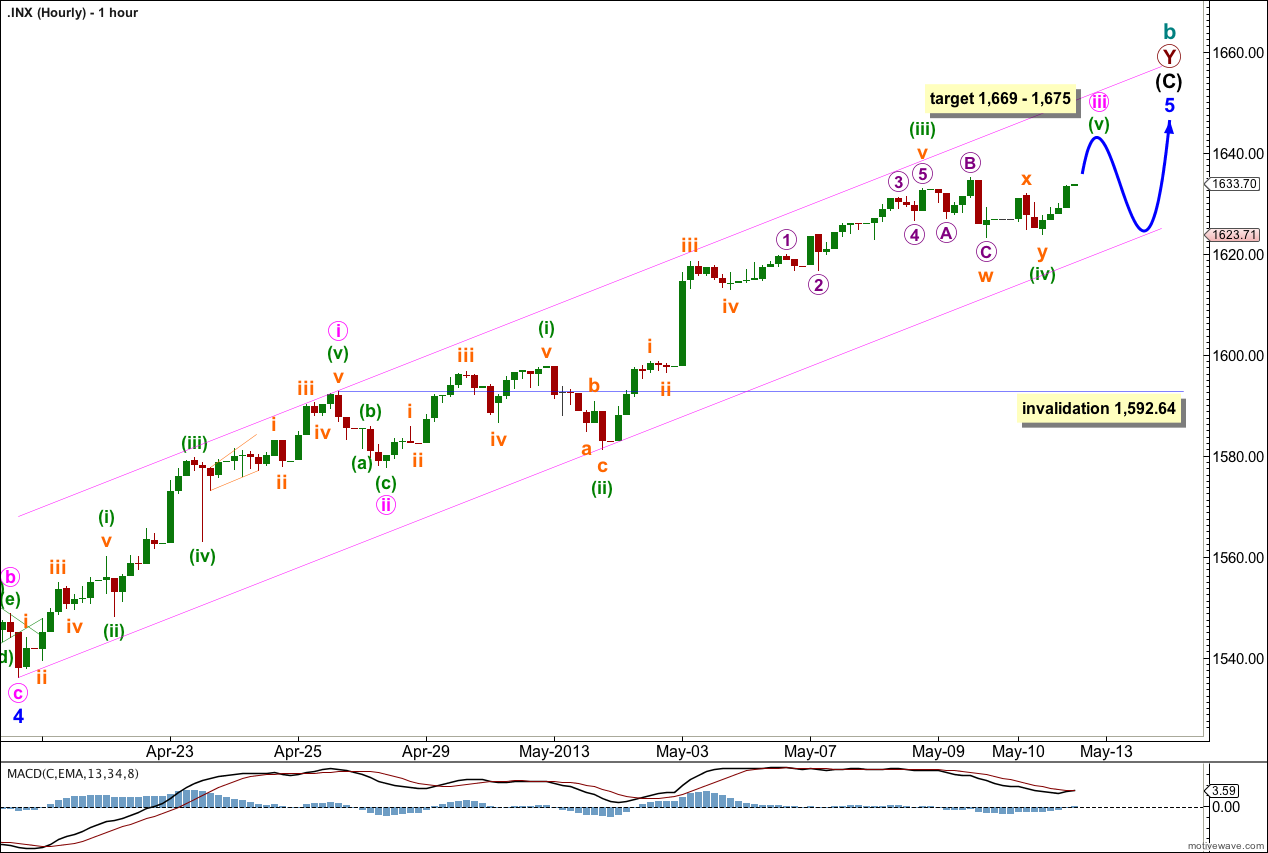
I have moved the labeling of minute wave iii. I expect this third wave is not over and will be longer than minute wave i, which is most likely.
Within minute wave iii so far minuette wave (iii) is just 0.89 points short of 2.618 the length of minuette wave (i).
There are no adequate Fibonacci ratios within minuette wave (iii).
Sideways movement for Friday may have been a continuation of minuette wave (iv) as a double combination: flat – X – zigzag. On the five minute chart the upwards wave labeled subminuette wave x within minuette wave (iv) subdivides into a three and is unlikely to be a first wave upwards.
Keep drawing this channel on the hourly chart. Draw the first trend line from the start of minor wave 5 to the low of minuette wave (ii). Place a parallel copy upon the high of minute wave i. Expect price to find support and resistance at these trend lines.
At 1,675 minuette wave (v) would reach equality in length with minuette wave (iii). However, there is already an excellent Fibonacci ratio between minuette waves (i) and (iii) so we may not see a Fibonacci ratio between minuette wave (v) and either of (i) or (iii). For this reason I favour the lower end of the target zone.
At 1,669 minute wave iii would reach 1.618 the length of minute wave i.
The following correction for minute wave iv may not move back into minute wave i price territory. This wave count is invalidated at minute wave degree with movement below 1,592.64.
NYMO drops 60% today (3 bearish divergence) http://scharts.co/18EbOMB // some type of top is getting close.
Would like to see NYMO push over 60.04 for the balance of this 175 point move from 1536.03 http://scharts.co/18Ec2mQ
Hi lara,
i am new to your S&P 500 Elliott Wave Technical Analysis , 1-2 monthes
Very happy with your explanations, and I hope to be a subscriber for a long time,
Thank you very much for your analysis the big picture,
So ,only for this time, I wanted to share with you how I see it for now, and at the same time to compare this rally vs the rally of 2003-2007
http://tinypic.com/r/5n6gb9/5
Thanks for the link to your chart.
If you think that is a valid wave count then you need to confirm that the subdivisions within it fit. I’d start with that first five up; each of the three actionary waves, 1, 3 and 5, must subdivide into five wave structures.
no , i do not know if this a valid count, and this is the reason that i am a subscriber , i want to learn from the best.
but My tiny experience showed me that the picture I sent is pretty much how the market works in most cases. but I could be very wrong.
Thank you very very much for that, you relate to my post,
The best way to learn is by doing.
To find out if your wave count is valid you would have to look to see if the subdivisions fit correctly. You are welcome to email me your charts and I will provide feedback to help you learn faster.
Thank you.