
Last analysis expected more upwards movement which is what we have seen. Price is on track to reach the short term target before we see a minute degree correction.
The target remains the same and the wave count remains the same. To see when the next correction will arrive we have to look carefully at the structure on a five minute chart.
Click on the charts below to enlarge.
This trend is not over and price should continue to move higher for maybe about another two to four weeks.
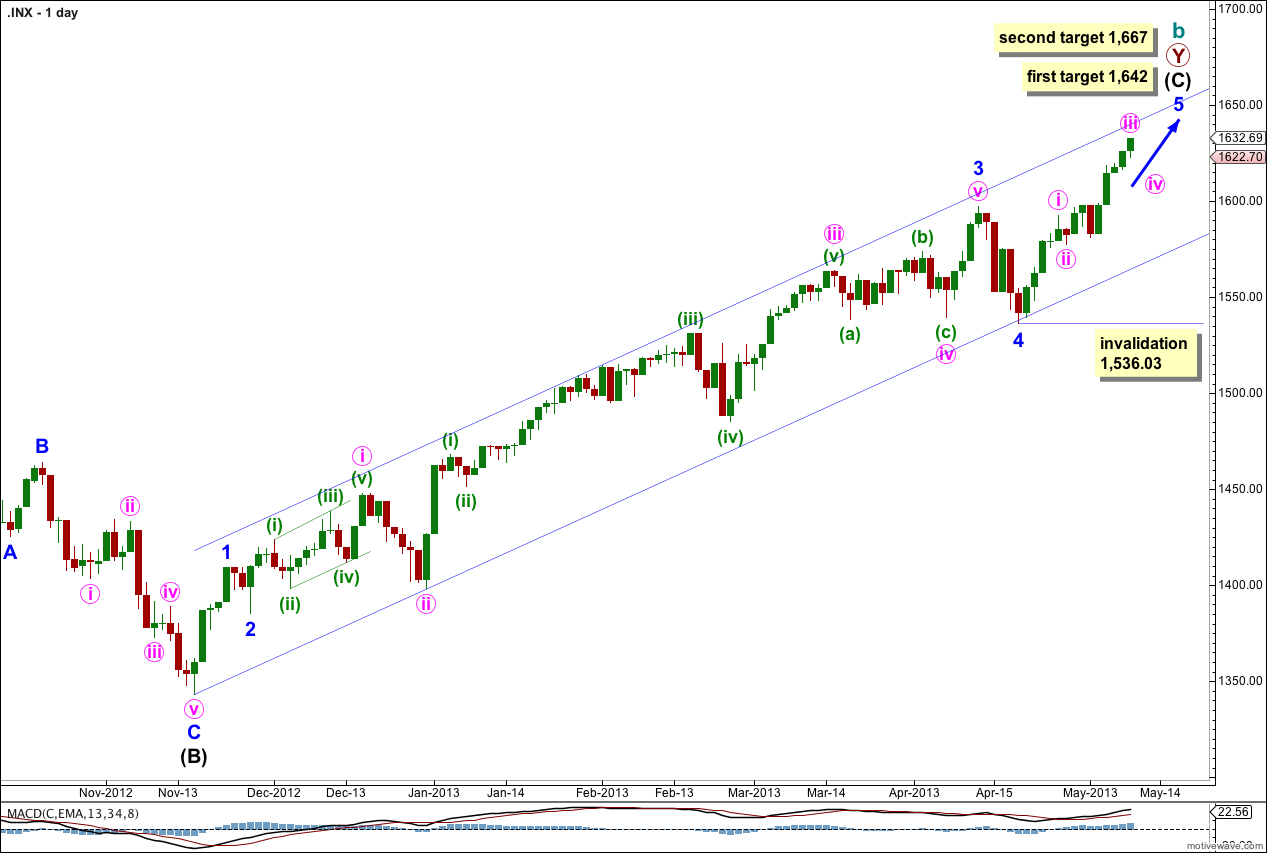
Draw a channel about intermediate wave (C) here on the daily chart. Draw the first trend line from the start of intermediate wave (C) to the low of minute wave iii within minor wave 3. Place a parallel copy to contain all this upwards movement. So far this channel shows very closely where price is finding support and resistance and should continue to do so.
The wave count within minor wave 3 fits with MACD as an indicator of momentum. The strongest piece of upwards movement within intermediate wave (C) corresponds to the middle of a third wave.
Within intermediate wave (C) minor wave 4 is over and minor wave 5 is underway. Because there is no Fibonacci ratio between minor waves 1 and 3 I would expect to see a ratio for minor wave 5.
Minor wave 5 has passed equality with minor wave 1 and its structure is incomplete. The next target is at 1,642 where minor wave 5 would reach 1.618 the length of minor wave 1. If price continues upwards through this target the next target is at 1,667 where minor wave 5 would reach 0.618 the length of minor wave 3.
Within minor wave 5 no second wave correction may move beyond the start of its first wave. This wave count is invalidated with movement below 1,536.03.
At this stage minor wave 5 has lasted 14 days. It if takes another seven days it may last a Fibonacci 21. Please note: Fibonacci time relationships are not as reliable as Fibonacci price relationships, this is a guideline only.
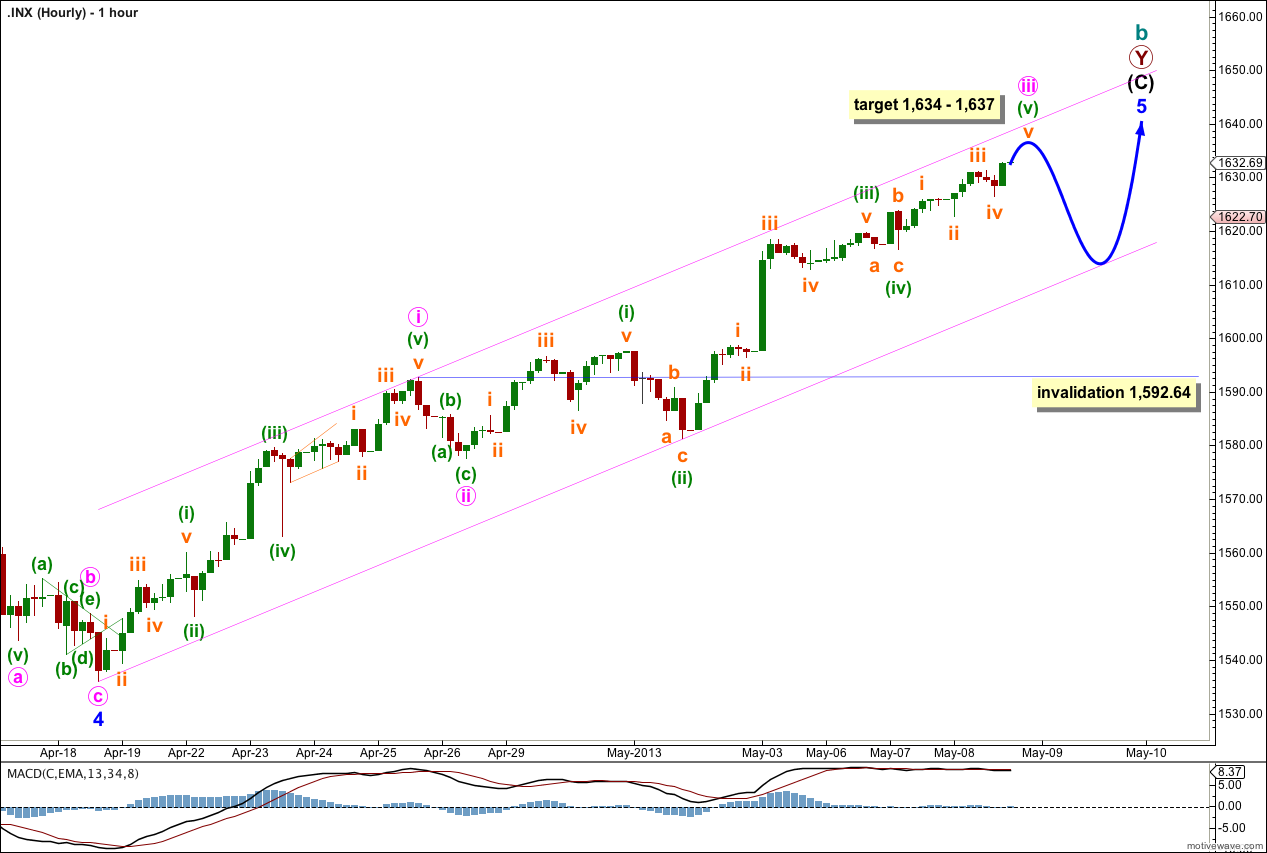
Within the structure of minuette wave (v) we may have seen subminuette waves i through to iv complete.
Alternatively, only subminuette wave i may be almost complete (if we move the degree of labeling within minuette wave (v) down one degree).
At 1,634 minute wave iii would reach equality with minute wave i.
At 1,637 minuette wave (v) would reach equality in length with minuette wave (i). Because there is no Fibonacci ratio between minuette waves (i) and (iii) I would expect to see minuette wave (v) exhibit a Fibonacci ratio.
At 1,635 subminuette wave v within minuette wave (v) would reach equality with subminuette wave iii. There is no Fibonacci ratio between subminuette waves i and iii so I would expect to see a Fibonacci ratio for subminuette wave v.
This target should be met early next session. I favour the lower end of the target zone because it is calculated at a lower degree.
Thereafter, we should expect a larger correction for minute wave iv to find support about the lower edge of this parallel channel and to last one to four sessions.
Minute wave iv may not move into minute wave i price territory. This wave count is invalidated with movement below 1,592.64.
Looks like a summertime TOP 1635.01 .. NYMO 60% yesterday // under 35% today http://scharts.co/18wRFYZ