
Last analysis main hourly wave count expected more upwards movement for Tuesday’s session, after a small fourth wave correction had completed. This is exactly what has happened. The alternate hourly wave count is not invalidated but now looks much less likely so I will discard it.
I have just the one daily and hourly chart for you today.
Click on the charts below to enlarge.
This trend is not over and price should continue to move higher for maybe about another two to four weeks.
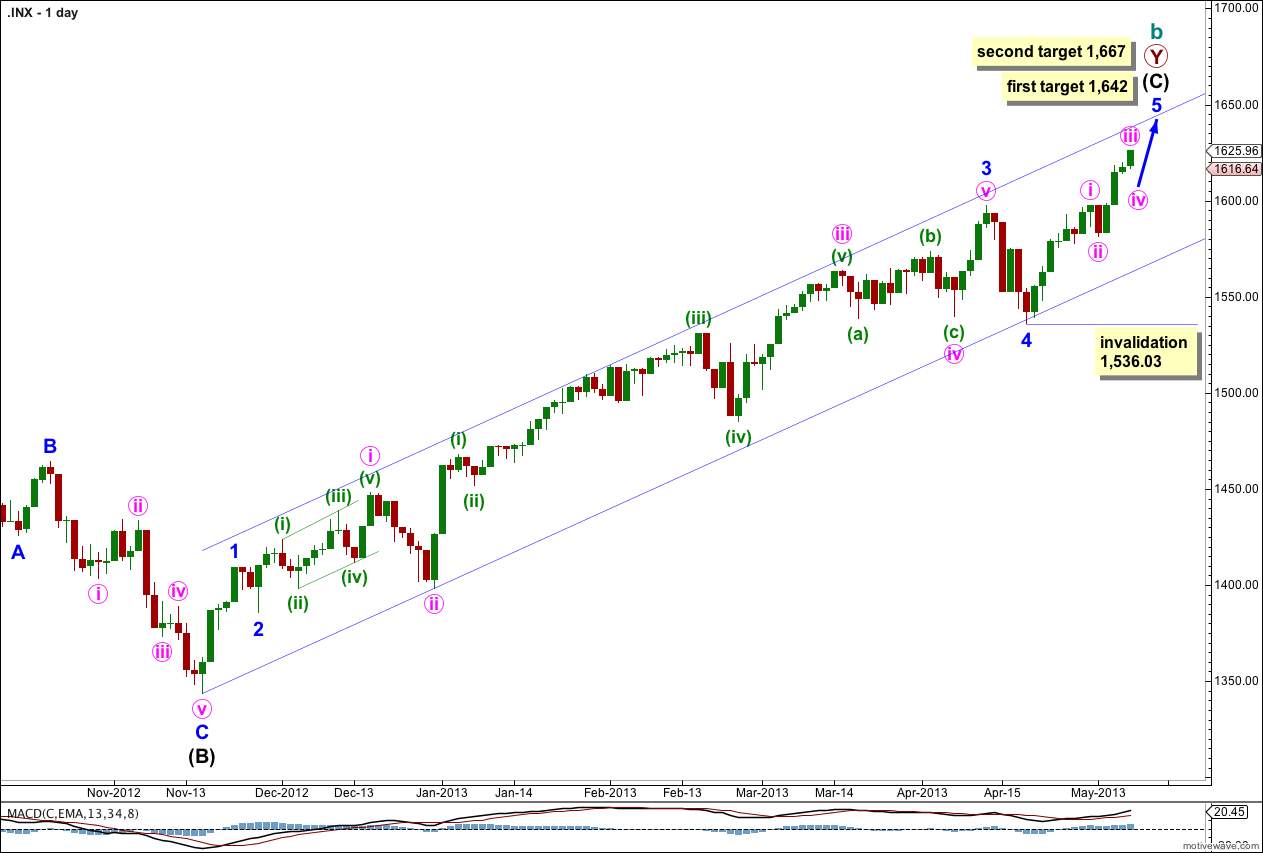
Draw a channel about intermediate wave (C) here on the daily chart. Draw the first trend line from the start of intermediate wave (C) to the low of minute wave iii within minor wave 3. Place a parallel copy to contain all this upwards movement. So far this channel shows very closely where price is finding support and resistance and should continue to do so.
The wave count within minor wave 3 fits with MACD as an indicator of momentum. The strongest piece of upwards movement within intermediate wave (C) corresponds to the middle of a third wave.
Within intermediate wave (C) minor wave 4 is over and minor wave 5 is underway. Because there is no Fibonacci ratio between minor waves 1 and 3 I would expect to see a ratio for minor wave 5.
Minor wave 5 has passed equality with minor wave 1 and its structure is incomplete. The next target is at 1,642 where minor wave 5 would reach 1.618 the length of minor wave 1. If price continues upwards through this target the next target is at 1,667 where minor wave 5 would reach 0.618 the length of minor wave 3.
Within minor wave 5 no second wave correction may move beyond the start of its first wave. This wave count is invalidated with movement below 1,536.03.
At this stage minor wave 5 has lasted 13 days. It if takes another eight days it may last a Fibonacci 21. Please note: Fibonacci time relationships are not as reliable as Fibonacci price relationships, this is a guideline only.
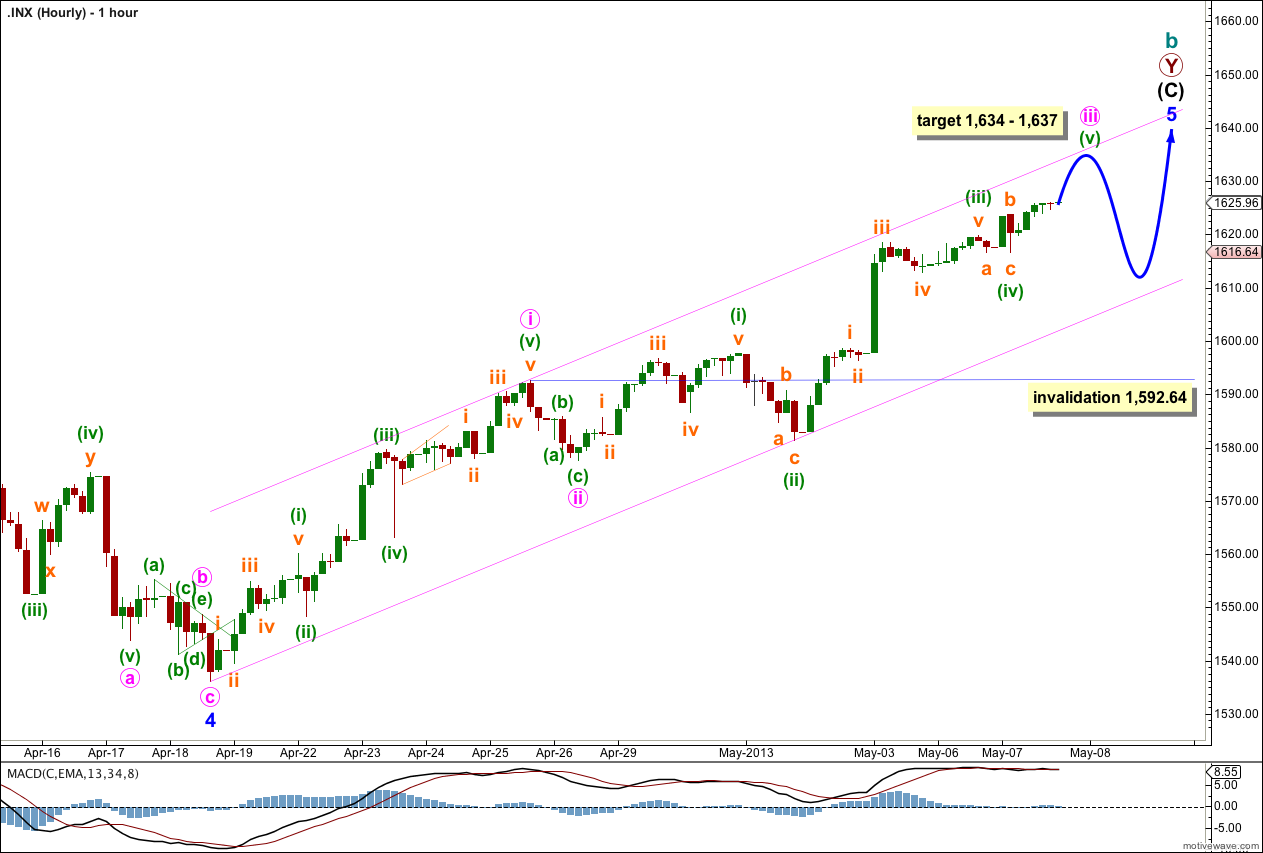
Tuesday’s session began by completing an expanded flat for minuette wave (iv). Within minuette wave (iv) there is no Fibonacci ratio between subminuette waves a and c. Subminuette wave c ended just 0.04 points below the end of subminuette wave a and so just avoided a truncation and a rare running flat.
Thereafter, upwards movement may be minuette wave (v) unfolding.
At 1,634 minute wave iii would reach equality with minute wave i. At 1,637 minuette wave (v) would reach equality in length with minuette wave (i). Because there is no Fibonacci ratio between minuette waves (i) and (iii) I would expect to see minuette wave (v) exhibit a Fibonacci ratio.
This gives us a three point target zone with a good probability. This target may be met next session or maybe the session after.
When minute wave iii is a completed five wave impulse then we should expect a correction for minute wave iv to last at least one full session, and maybe up to four sessions. Minute wave iv may not move into minute wave i price territory. This wave count is invalidated with movement below 1,592.64.
Minute wave iv should exhibit alternation with minute wave ii. It may be a deep correction of minute wave iii and is most likely to unfold as a flat or combination.