
Last analysis expected upwards movement for Monday’s session towards a short term target at 1,630. Price has moved slightly higher, but has failed to reach the target by a very long way.
The wave count at the daily chart level remains the same. I have two hourly wave counts for you. They have the same invalidation point but the expected direction for tomorrow differs.
Click on the charts below to enlarge.
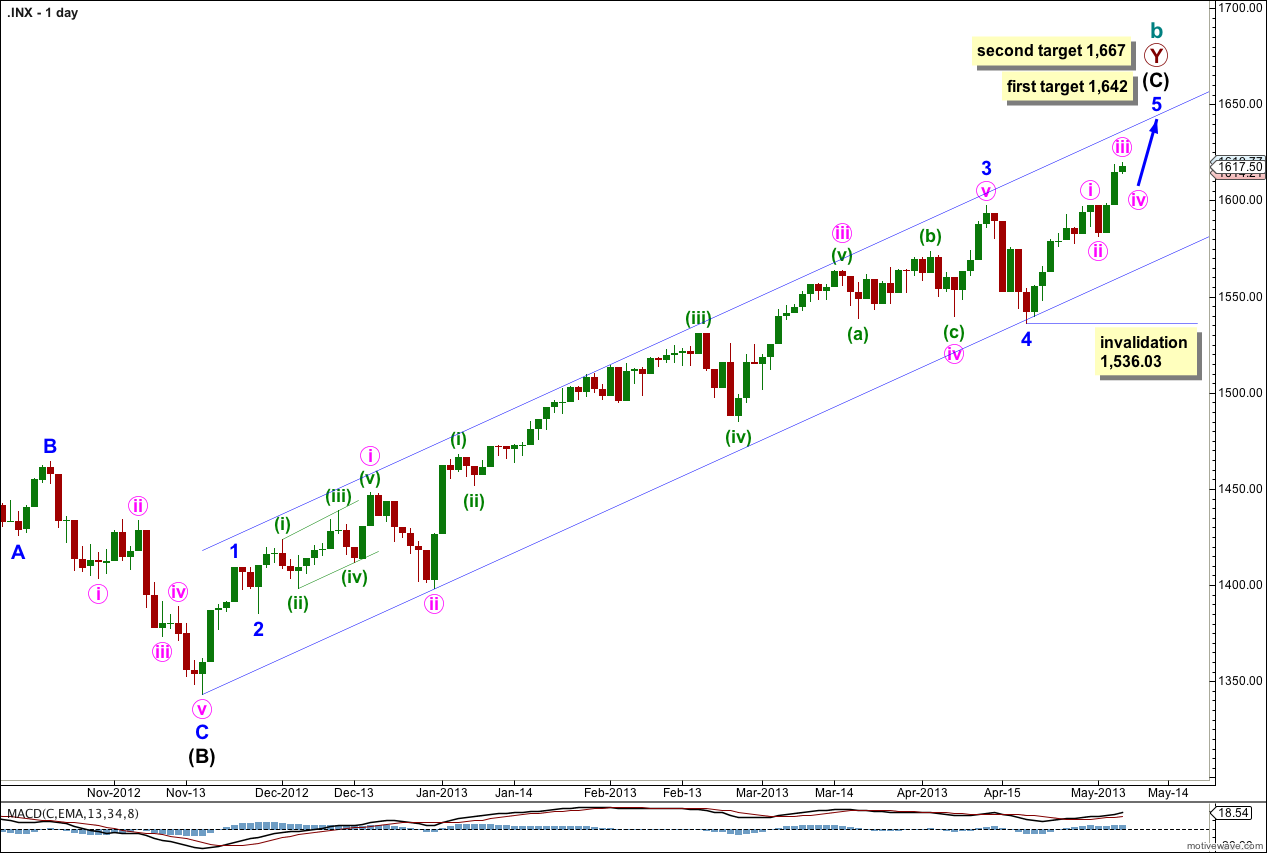
This trend is not over and price should continue to move higher for maybe about another two to four weeks.
Draw a channel about intermediate wave (C) here on the daily chart. Draw the first trend line from the start of intermediate wave (C) to the low of minute wave iii within minor wave 3. Place a parallel copy to contain all this upwards movement. So far this channel shows very closely where price is finding support and resistance and should continue to do so.
The wave count within minor wave 3 fits with MACD as an indicator of momentum. The strongest piece of upwards movement within intermediate wave (C) corresponds to the middle of a third wave.
Within intermediate wave (C) minor wave 4 is over and minor wave 5 is underway. Because there is no Fibonacci ratio between minor waves 1 and 3 I would expect to see a ratio for minor wave 5.
Minor wave 5 has passed equality with minor wave 1 and its structure is incomplete. The next target is at 1,642 where minor wave 5 would reach 1.618 the length of minor wave 1. If price continues upwards through this target the next target is at 1,667 where minor wave 5 would reach 0.618 the length of minor wave 3.
Within minor wave 5 no second wave correction may move beyond the start of its first wave. This wave count is invalidated with movement below 1,536.03.
At this stage minor wave 5 has lasted 12 days. If it comes to a speedy end in just another one day it would last a Fibonacci 13. Otherwise, and much more likely, it may take yet another nine days in total (two weeks) to last a Fibonacci 21. Please note: Fibonacci time relationships are not as reliable as Fibonacci price relationships, this is a guideline only.
Main Hourly Wave Count.
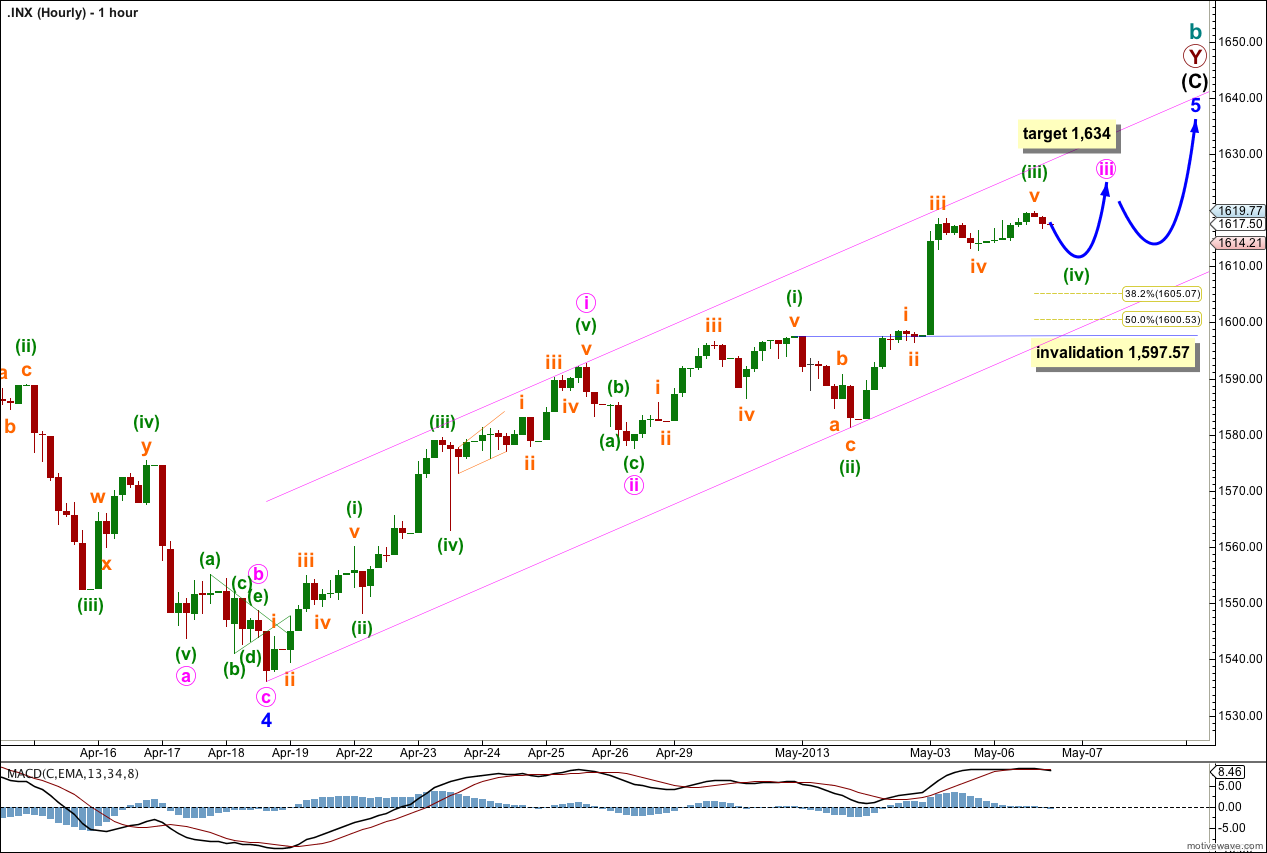
If we move the high labeled minute wave i lower down then we may have not yet seen the end of minute wave iii.
This wave count expects a very small amount of downwards movement early tomorrow for minuette wave (iv) to end about the fourth wave of one lesser degree at 1,612.85 (or a little above) before upwards movement for the session.
This wave count agrees with MACD in that it sees the strongest upwards momentum as within the middle of the third wave.
Ratios within minute wave i are better than the alternate below: minuette wave (iii) has no Fibonacci ratio to minuette wave (i), and minuette wave (v) is just 1.78 points short of equality with minuette wave (iii).
Within minute wave iii there is no Fibonacci ratio between minuette waves (i) and (iii). We should expect to see a Fibonacci ratio between minuette wave (v) and either of (iii) or (i), but because minuette wave (iv) is most likely incomplete I cannot use minuette wave degree to calculate tomorrow’s target for you. Expect minuette wave (v) may be about 20 points in length to reach equality with minuette wave (i).
At 1,634 minute wave iii would reach equality with minute wave i.
I have drawn a best fit channel about the impulse for minor wave 5. Draw the first trend line from the start of minor wave 5 to the end of minuette wave (ii) within minute wave iii. Place a parallel copy upon the high of minute wave i. I would expect downwards corrections along the way to find support about the lower trend line.
When markets open tomorrow minuette wave (iv) may not move into minuette wave (i) price territory. This wave count is invalidated with movement below 1,597.57.
Alternate Hourly Wave Count.
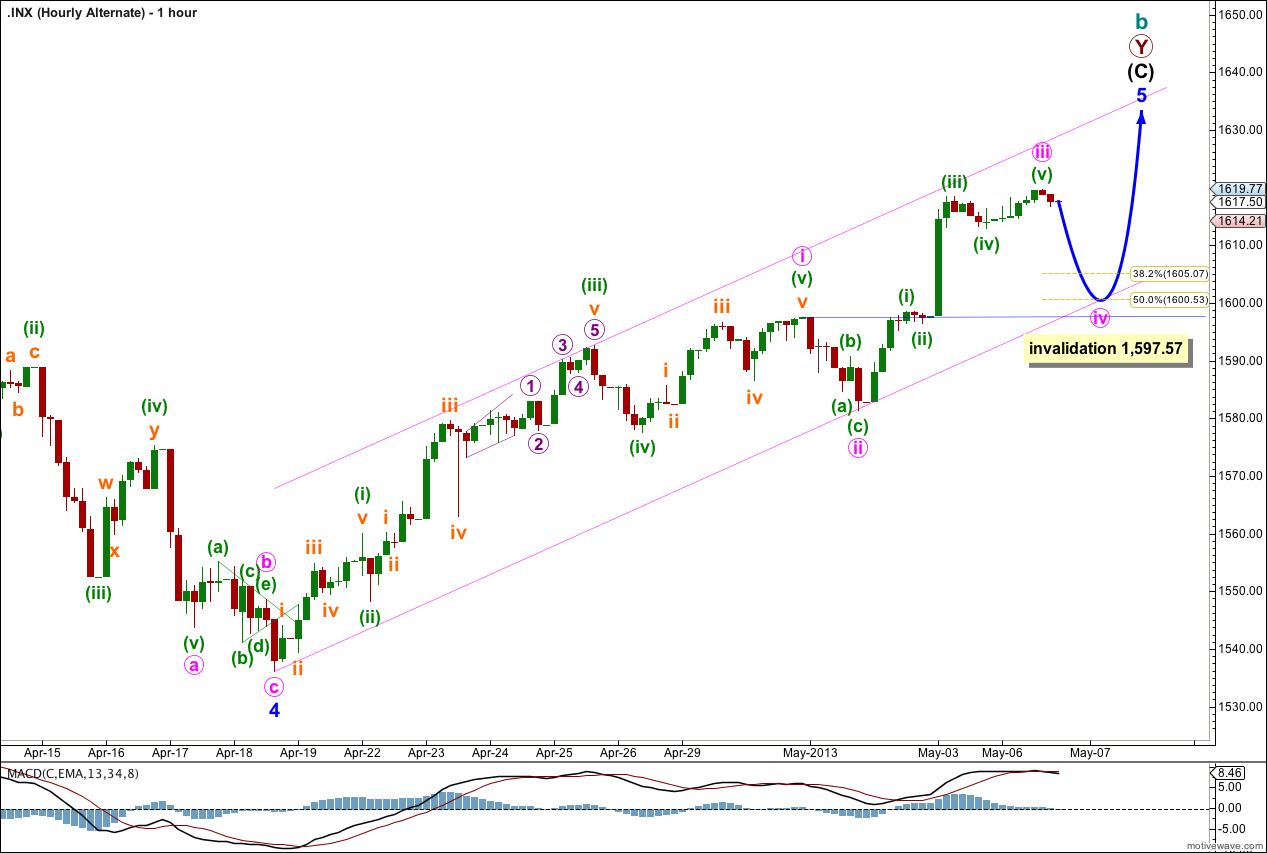
This wave count follows on directly from the hourly chart for last analysis.
Upwards movement for Monday’s session may have taken minute wave iii to just 0.46 points above 0.618 the length of minute wave i.
Ratios within minute wave iii are: minuette wave (ii) has no Fibonacci ratio to minuette wave (i), and minuette wave (v) is just 0.31 points longer than 0.382 the length of minuette wave (i).
This wave count agrees with MACD; the strongest upwards momentum is within the third wave.
Within minute wave i there are no Fibonacci ratios between minuette waves (i), (iii) and (v).
Minute wave ii was a very shallow 26% zigzag correction of minute wave i. Given the guideline of alternation we may expect minute wave iv to be deeper than 26% of minute wave iii. It may reach down to the 0.382 Fibonacci ratio of minute wave iii at 1,605.04, or it may be just over 50% of minute wave iii at 1,600.53.
Minute wave ii was a zigzag structure so minute wave iv would most likely be (in order of probability) a flat, combination, triangle or double zigzag.
Minute wave ii lasted just one session so I would expect minute wave iv to last about the same. If it is a combination or triangle it may be more long lasting.
Minute wave iv may not move into minute wave i price territory. This wave count is invalidated with movement below 1,597.57.