
Yesterday’s analysis expected downwards movement which is not what happened. However, this upwards movement may still be part of this second wave if it is unfolding as an expanded flat correction.
The wave count remains the same. I have two hourly wave counts for you today.
The alternate daily wave count from yesterday has been invalidated.
Click on the charts below to enlarge.
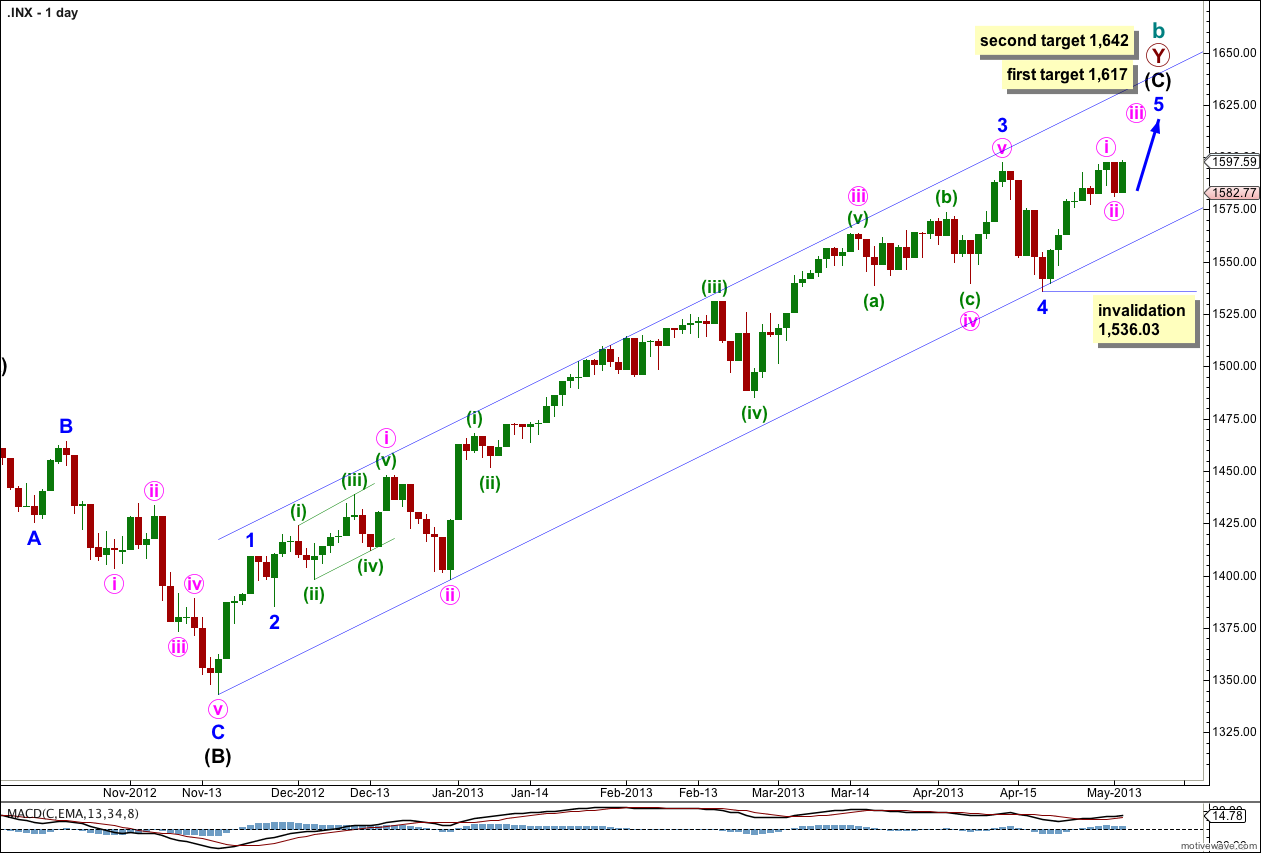
This trend is not over and price should continue to move higher for maybe about another two to four weeks.
Draw a channel about intermediate wave (C) here on the daily chart. Draw the first trend line from the start of intermediate wave (C) to the low of minute wave iii within minor wave 3. Place a parallel copy to contain all this upwards movement. So far this channel shows very closely where price is finding support and resistance and should continue to do so.
The wave count within minor wave 3 too fits with MACD as an indicator of momentum. The strongest piece of upwards movement within intermediate wave (C) corresponds to the middle of a third wave.
Within intermediate wave (C) minor wave 4 is over and minor wave 5 is underway. Because there is no Fibonacci ratio between minor waves 1 and 3 I would expect to see a ratio for minor wave 5.
Looking at the structure of minor wave 5 on the hourly chart it looks like it may be longer than equality with minor wave 1. The next expected ratio would be at 1,617 where minor wave 5 would reach 0.382 the length of minor wave 1. If price continues upwards through this first target the next target is at 1,642 where minor wave 5 would reach 1.618 the length of minor wave 1.
Within minor wave 5 no second wave correction may move beyond the start of its first wave. This wave count is invalidated with movement below 1,536.03.
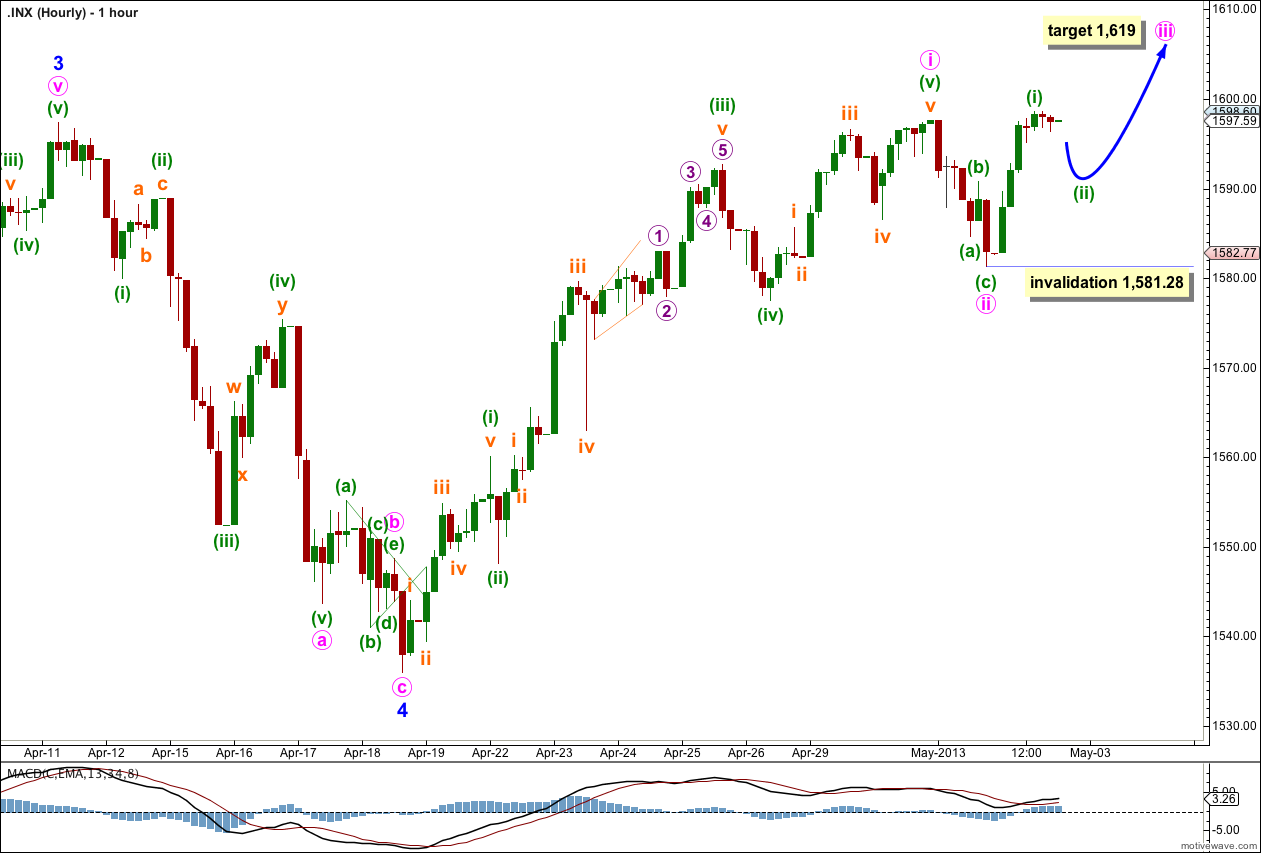
Minute wave ii may have been over as a brief shallow 26% zigzag.
This is my main hourly wave count because so far the upwards movement labeled here minuette wave (i) subdivides best on the five minute chart as a five wave impulse.
If this wave count is correct then tomorrow we should see a brief second wave correction for minuette wave (ii) before price turns higher for the middle of a third wave.
Because minute wave ii was so shallow minute wave iii may be shorter than minute wave i. At 1,619 minute wave iii would reach 0.618 the length of minute wave i.
When there is more structure to analyse within minute wave iii I will use minuette wave degree within it to refine this target so it will probably change.
Within minute wave iii minuette wave (ii) may not move beyond the start of minuette wave (i). This wave count is invalidated with movement below 1,581.28.
If price moves below 1,581.28 use the alternate wave count below.
Alternate Hourly Wave Count.
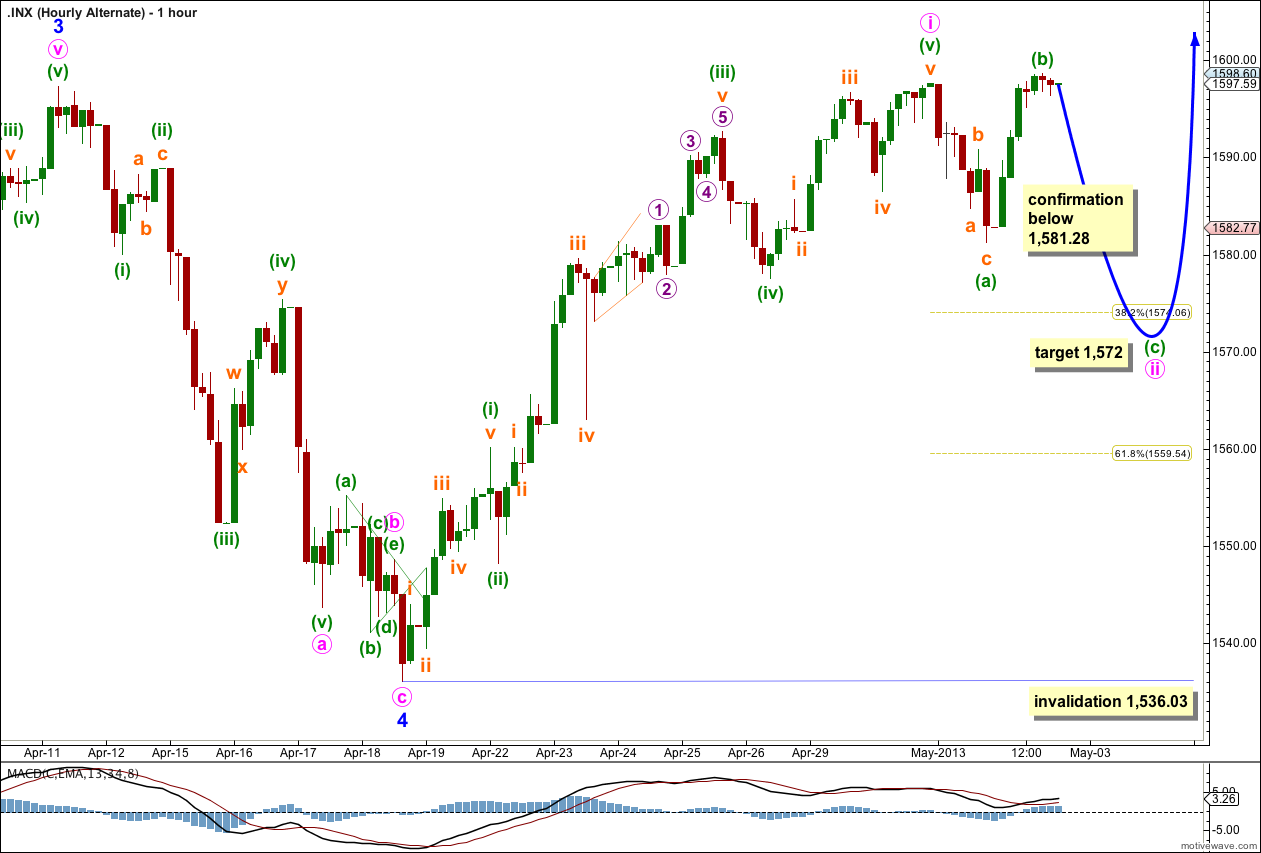
If we move the degree of labeling within minute wave ii down one degree then it may be that only minuette wave (a) is complete. Minuette wave (b) may be complete, or it may move a very small amount higher before ending. If it did move a little higher the problem of subdivisions within it would be resolved.
Minuette wave (b) is over 105% the length of minuette wave (a) so minute wave ii may be unfolding as an expanded flat correction. The most likely length for minuette wave (c) within the expanded flat would be 1.618 the length of minuette wave (a) at 1,572. This would see minute wave ii correct to just below the 0.382 Fibonacci ratio of minute wave i.
Minute wave ii may not move beyond the start of minute wave i. This wave count is invalidated with movement below 1,536.03.
Looking for your daily or 1 hour chart going to 1700 … thanks