
Last analysis expected most likely to see upwards movement for Monday’s session for the S&P 500 towards a short term target at 1,599. Price has moved higher but the target is not yet reached. Analysis of the subdivisions on the hourly and five minute charts will indicate if this structure is complete and fall short of the target, or if it should continue yet further higher.
Click on the charts below to enlarge.
Main Wave Count.
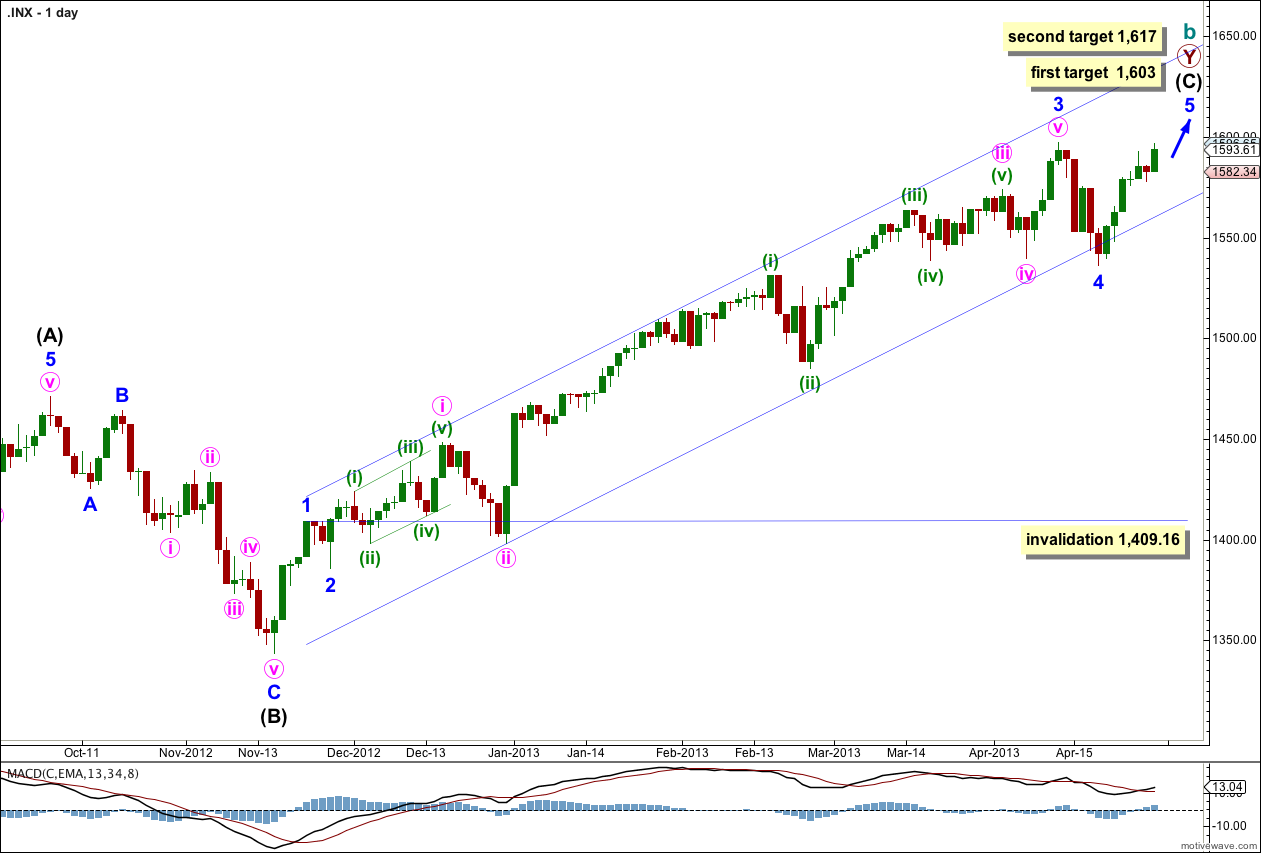
This is my main wave count because we should always assume the trend remains the same, until proven otherwise. We do not have sufficient confirmation of a trend change so we should assume we shall see more upwards movement.
The channel drawn here is a conservative best fit. Draw the first trend line from the highs of minor waves 1 to 3 and push it upwards to enclose all upwards movement. Place a parallel copy upon the low of minute wave ii within minor wave 3. Minor wave 4 should find some support about the lower edge of this channel.
Minor wave 4 may now be complete; it subdivides into a three on the hourly chart. Alternatively, we may move the degree of labeling within it down one degree and only minute wave a within minor wave 4 may have completed. I expect it is most likely to be complete because it is in proportion to other corrections within intermediate wave (C) and it has lasted a Fibonacci 5 days.
There is no Fibonacci ratio between minor waves 1 and 3. This means it is more likely we shall see a Fibonacci ratio between minor wave 5 and either of 1 or 3. At 1,603 minor wave 5 would reach equality with minor wave 1. This is the most likely Fibonacci relationship for minor wave 5 so this target has a good probability.
If price continues upwards through the first target then we may use the next Fibonacci ratio. At 1,617 minor wave 5 would reach 0.382 the length of minor wave 3.
If minor wave 5 continues for another six days it would have totaled a Fibonacci thirteen days. Please note: Fibonacci time relationships are not as reliable as price. This expectation is a rough guideline, something to look out for, but should not be relied upon.
If it continues further minor wave 4 may not move into minor wave 1 price territory. This wave count is invalidated with movement below 1,409.16.
On the five minute chart this main hourly wave count has a better fit than the alternate, although both are possible.
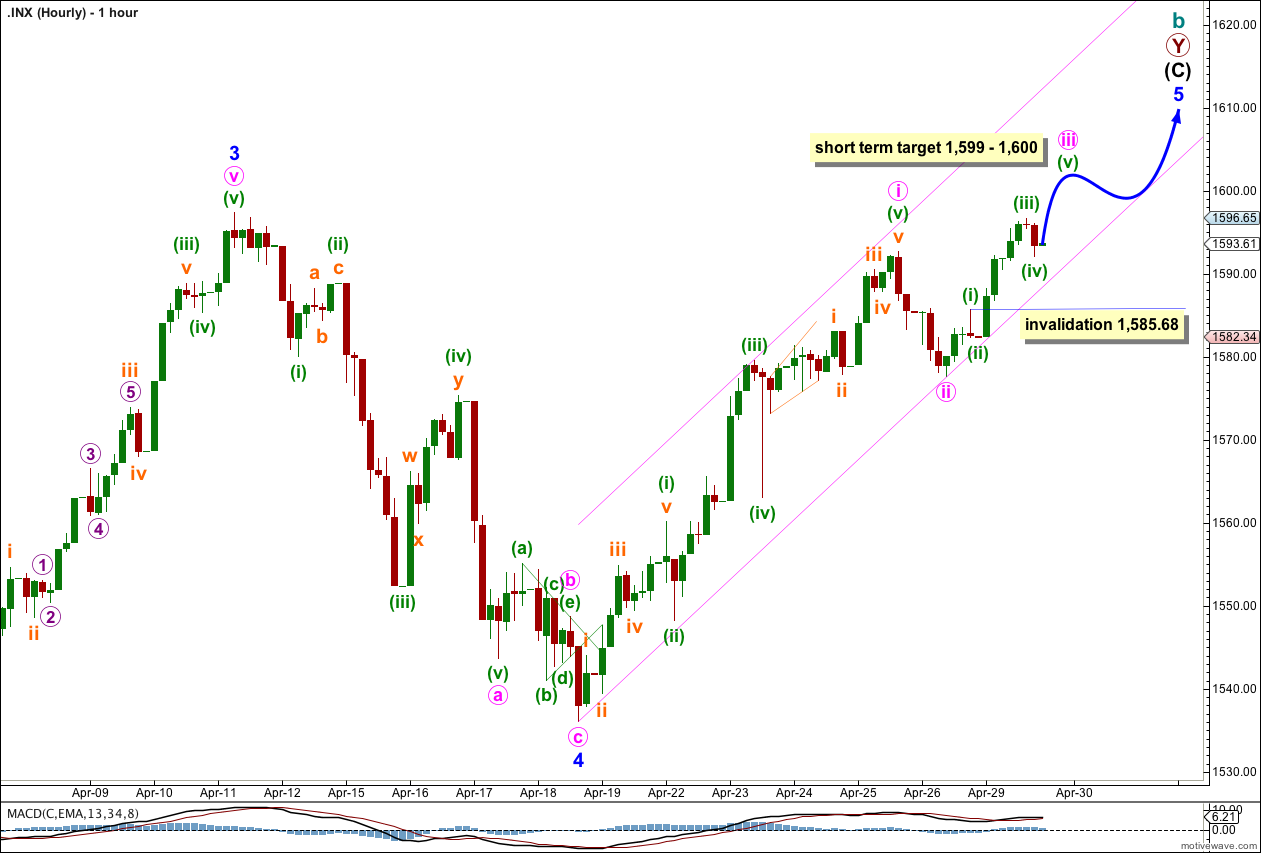
However, we did not see an increase in upwards momentum as indicated by MACD. If minute wave iii is unfolding we should see an increase in momentum. This may happen over the next couple of sessions, if this wave count is correct.
In the short term at 1,599 minute wave iii would reach 0.382 the length of minute wave i. At 1,600 minuette wave (v) within minute wave iii would reach equality in length with minuette wave (i).
I have drawn an acceleration channel about this upwards movement in the same way you would draw a corrective channel, from the start of the movement to the low of minute wave ii, with a parallel copy placed upon the high of minute wave i. Minute wave iii may break through the upper edge of this channel. If it does then the target may be exceeded and targets on the daily chart would also have to be recalculated higher.
Alternatively, minute wave iii may end within the channel about the target.
Within minute wave iii minuette wave (iv) may not move into minuette wave (i) price territory. This wave count is invalidated with movement below 1,585.68.
Alternate Wave Count.
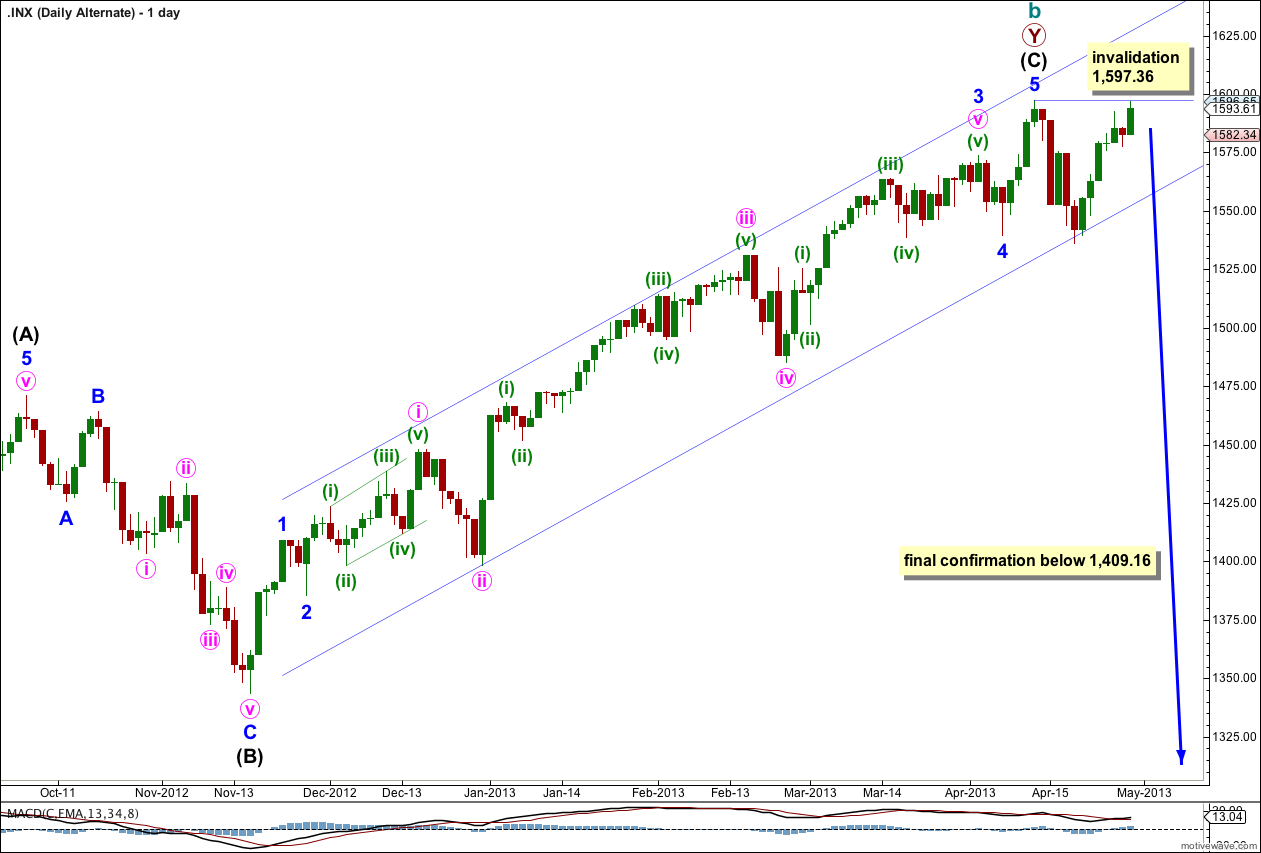
If this alternate wave count is correct and we have seen a trend change then tomorrow price should plummet. There can be no further delay. Tomorrow is make or break for this wave count.
It is possible that we have seen a trend change, but at this stage we do not have confirmation. There is a hanging man candlestick pattern, but this is an indicator only and not a reversal pattern.
This wave count agrees with MACD as an indicator of momentum. The strongest piece of movement is minuette wave (iii) within minute wave iii within minor wave 3, the very middle of the third wave.
The channel here is drawn the same as on the main daily wave count. I want to see a clear channel breach, with the most conservatively drawn channel (as this one is) before I have any confidence whatsoever in a possible trend change.
Final confirmation would come with invalidation of the main wave count with price movement below 1,409.16. At that stage we may have confidence that the S&P 500 should be in a new downwards trend to last one to several years and take price substantially below 666.76.
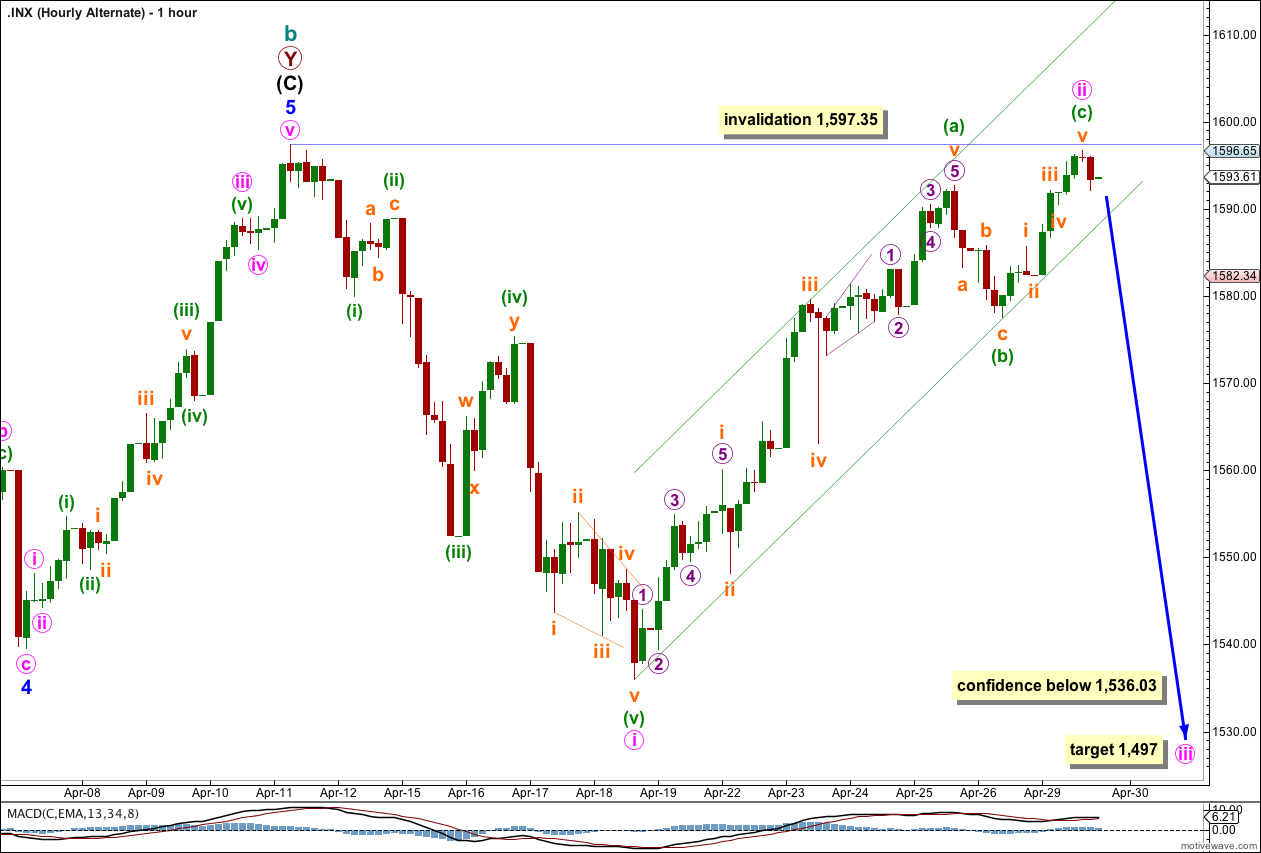
If minute wave i ended at the low of 1,536.03 then within it minuette wave (v) may have been an ending diagonal. However, within the diagonal subminuette wave iv has a very truncated C wave which reduces the probability that this wave count is correct a little further.
Upwards movement so far looks like a three wave structure. If this alternate is correct then it must be over here and a third wave down should begin tomorrow.
At 1,497 minute wave iii would reach 1.618 the length of minute wave i.
Minuete wave ii may not move beyond the start of minute wave i. This wave count is invalidated with movement above 1,597.35.