
I had expected Friday to continue with upwards movement to a short term target at 1,595. This is not what happened. Downwards movement invalidated the hourly wave count at minute wave degree.
The wave count at the daily chart level remains valid and is unchanged.
Click on the charts below to enlarge.
Main Wave Count.
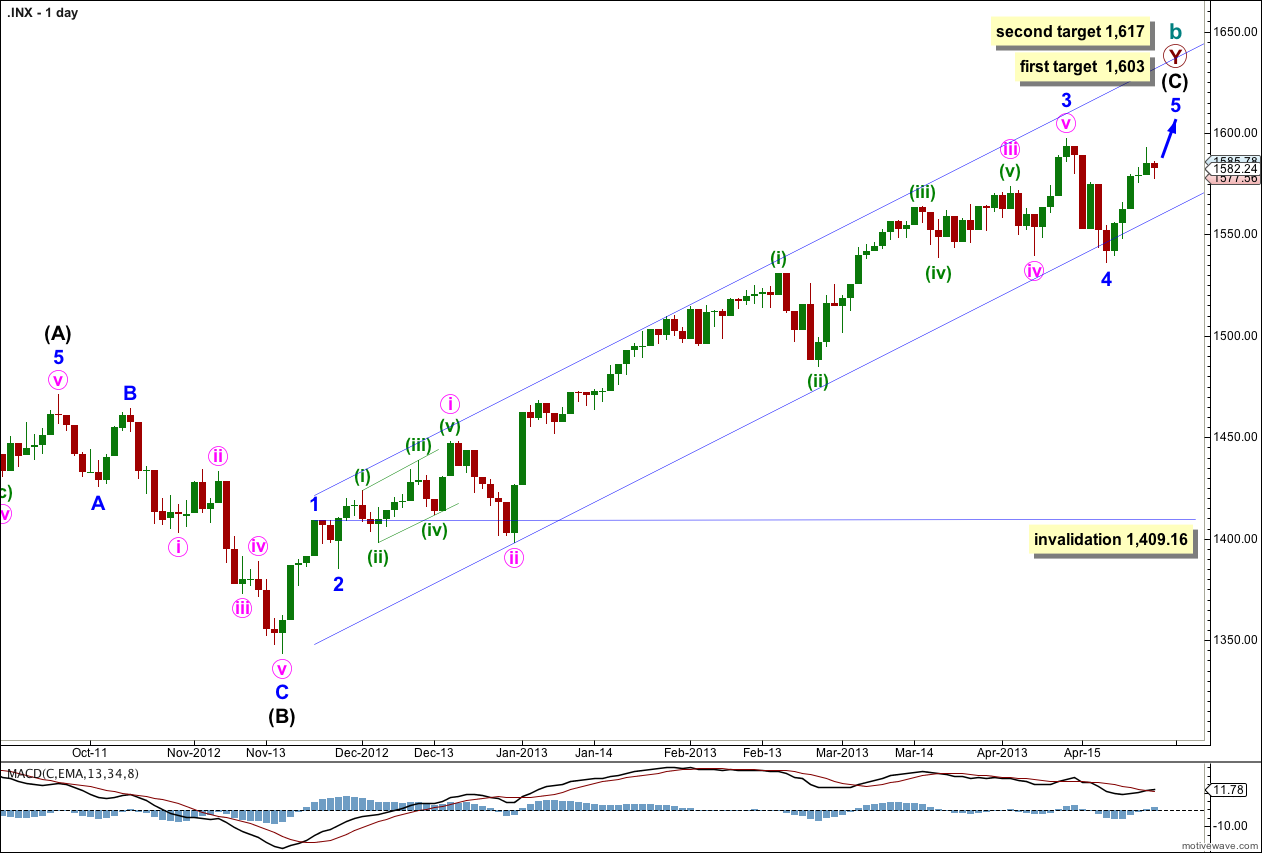
This is my main wave count because we should always assume the trend remains the same, until proven otherwise. We do not have sufficient confirmation of a trend change so we should assume we shall see more upwards movement.
The channel drawn here is a conservative best fit. Draw the first trend line from the highs of minor waves 1 to 3 and push it upwards to enclose all upwards movement. Place a parallel copy upon the low of minute wave ii within minor wave 3. Minor wave 4 should find some support about the lower edge of this channel.
Minor wave 4 may now be complete; it subdivides into a three on the hourly chart. Alternatively, we may move the degree of labeling within it down one degree and only minute wave a within minor wave 4 may have completed. I expect it is most likely to be complete because it is in proportion to other corrections within intermediate wave (C) and it has lasted a Fibonacci 5 days.
There is no Fibonacci ratio between minor waves 1 and 3. This means it is more likely we shall see a Fibonacci ratio between minor wave 5 and either of 1 or 3. At 1,603 minor wave 5 would reach equality with minor wave 1. This is the most likely Fibonacci relationship for minor wave 5 so this target has a good probability.
If price continues upwards through the first target then we may use the next Fibonacci ratio. At 1,617 minor wave 5 would reach 0.382 the length of minor wave 3.
If minor wave 5 continues for another two days it would have totaled a Fibonacci eight days. However, at this stage it looks it may take longer than another two days. It may continue further for another five days to total a Fibonacci thirteen. Please note: Fibonacci time relationships are not as reliable as price. This expectation is a rough guideline, something to look out for, but should not be relied upon.
If it continues further minor wave 4 may not move into minor wave 1 price territory. This wave count is invalidated with movement below 1,409.16.
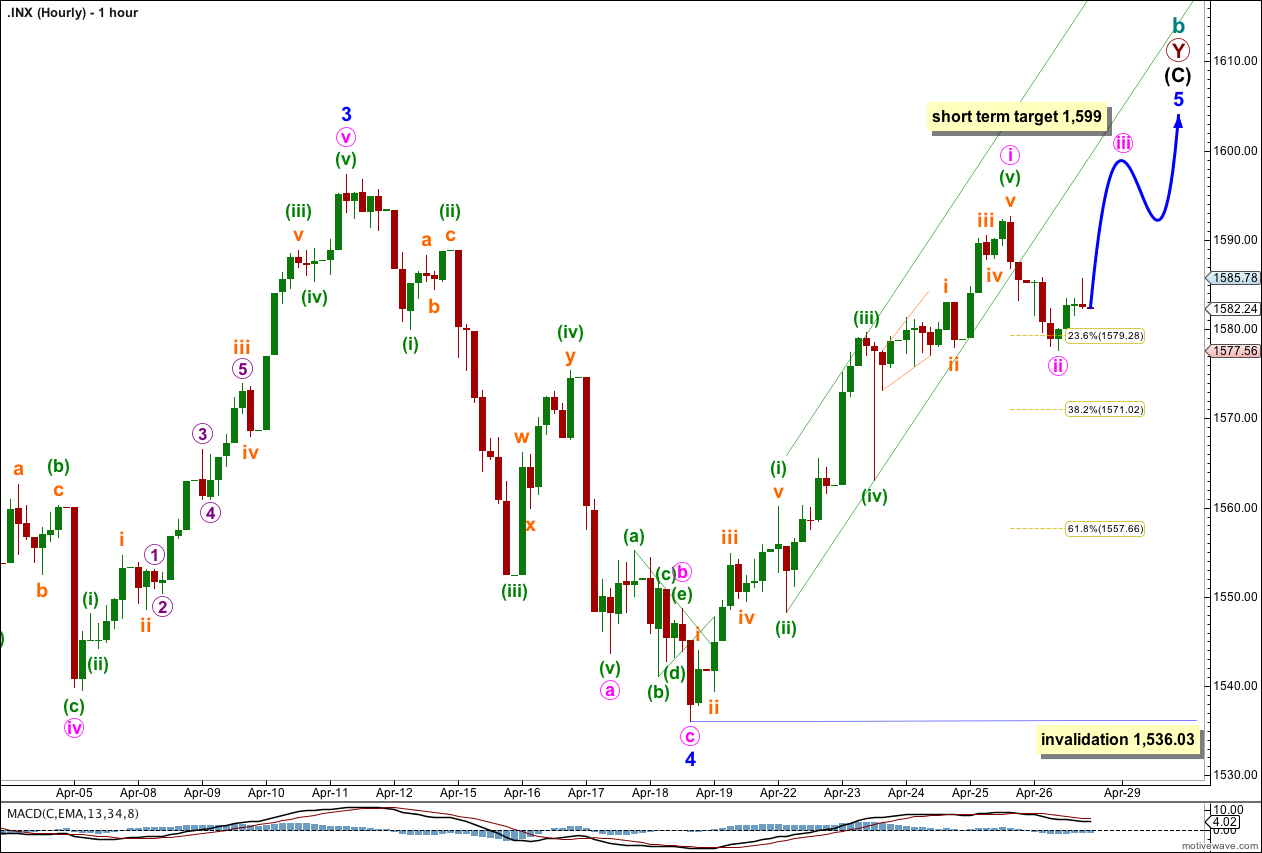
Movement below 1,579.58 invalidated the last main hourly wave count. Downwards movement for Friday’s session was not expected and was deeper than allowed for. This cannot be a fourth wave correction so it must be a second wave.
Movement below the channel drawn about this upwards movement indicates it is a complete structure and the next wave to correct the impulse has begun.
I have adjusted the hourly wave count to be essentially the same as subdivisions for the alternate hourly wave count for this upwards wave. Minute wave i was complete at 1,592.64 and minute wave ii began on Friday. Minute wave ii should last one to three sessions, but it is likely it could be over already as a shallow zigzag. On the five minute chart it subdivides perfectly into a zigzag.
At 1,599 minute wave iii would reach 0.382 the length of minute wave i. If minute wave iii is much longer than this then the second target on the daily chart at 1,617 for minor wave 5 to end would be a better fit than the first target.
If we move the degree of labeling down one degree we may have seen only minuette wave (a) within a flat for minute wave ii complete. If minute wave ii moves lower we may expect it to reach down to about the 0.618 Fibonacci ratio of minute wave i at 1,557.66. Minute wave ii may not move beyond the start of minute wave i. This wave count is invalidated with movement below 1,536.03.
Alternate Wave Count.
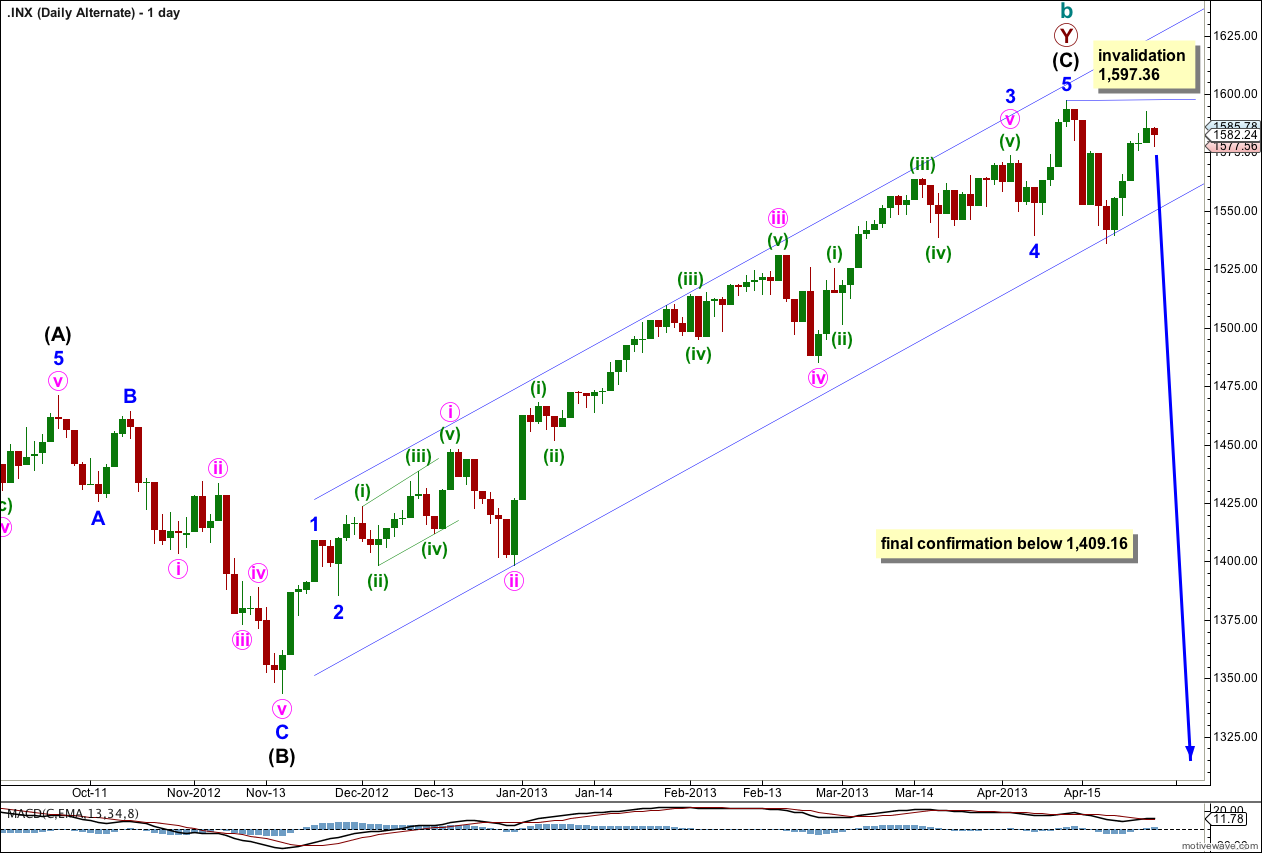
It is again possible that we have seen a trend change, but at this stage we do not have confirmation. There is a hanging man candlestick pattern, but this is an indicator only and not a reversal pattern.
This wave count agrees with MACD as an indicator of momentum. The strongest piece of movement is minuette wave (iii) within minute wave iii within minor wave 3, the very middle of the third wave.
The channel here is drawn the same as on the main daily wave count. I want to see a clear channel breach, with the most conservatively drawn channel (as this one is) before I have any confidence whatsoever in a possible trend change.
Final confirmation would come with invalidation of the main wave count with price movement below 1,409.16. At that stage we may have confidence that the S&P 500 should be in a new downwards trend to last one to several years and take price substantially below 666.76.
While price remains below 1,597.35 this alternate will remain valid.
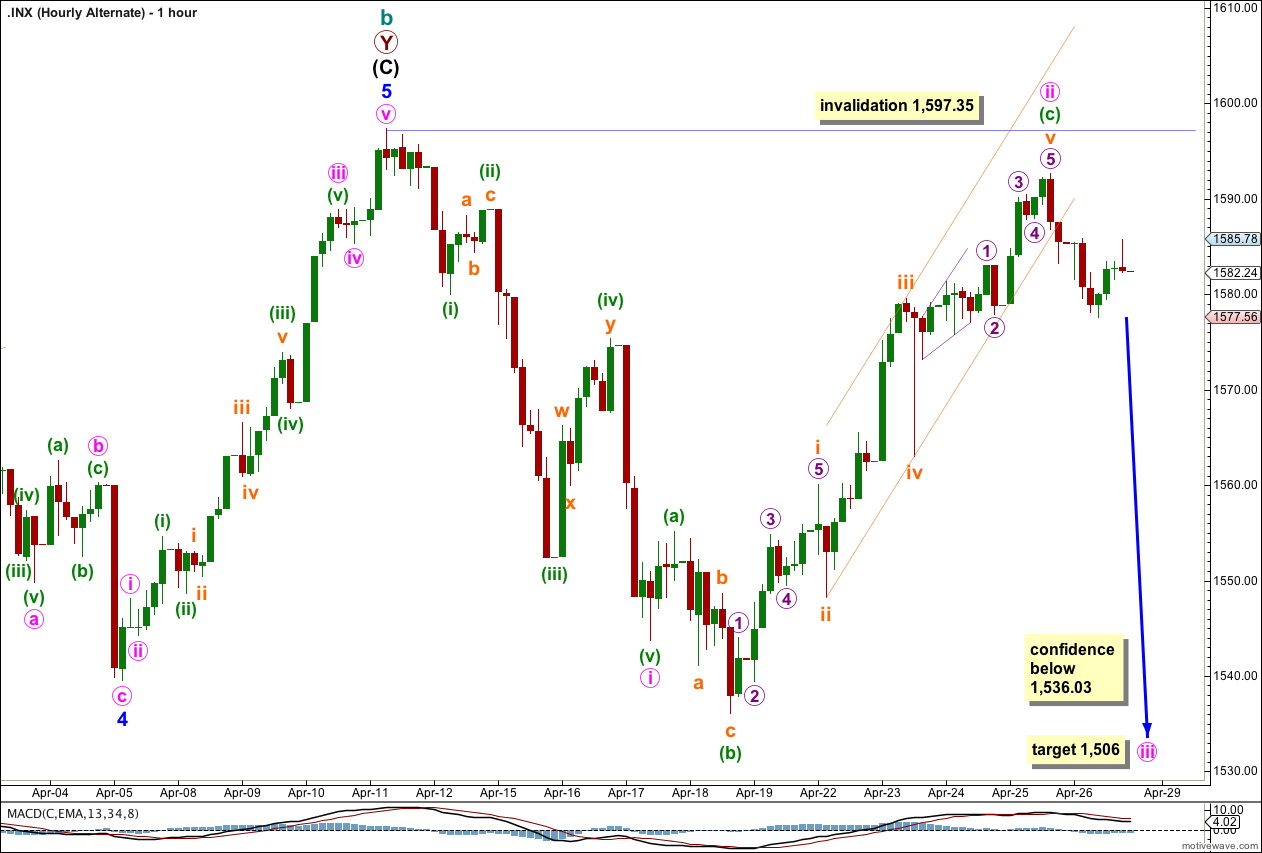
Within minute wave ii there is no Fibonacci ratio between minuette waves (a) and (c). The extreme length of minuette wave (c) in relation to minuette wave (a) gives this expanded flat an odd look and reduces the probability of this alternate wave count.
Movement below 1,536.03 would invalidate the main hourly wave count and give some confidence to the target for minute wave iii to reach 1.618 the length of minute wave i at 1,506.
If minute wave ii were to move any higher it may not move beyond the start of minute wave i at 1,597.35. Movement above 1,597.35 would invalidate this wave count.