
Yesterday’s main wave count expected Thursday’s session to most likely open with a little downwards movement to about 1,570.66 or below, before turning back up to reach new highs during the session.
Price did not move lower. Movement above 1,583 indicated clearly it would not, and that it would continue higher towards upwards targets. Price has remained contained within the parallel channel on the hourly chart.
We still have the same two wave counts. The alternate is close to invalidation.
Click on the charts below to enlarge.
Main Wave Count.
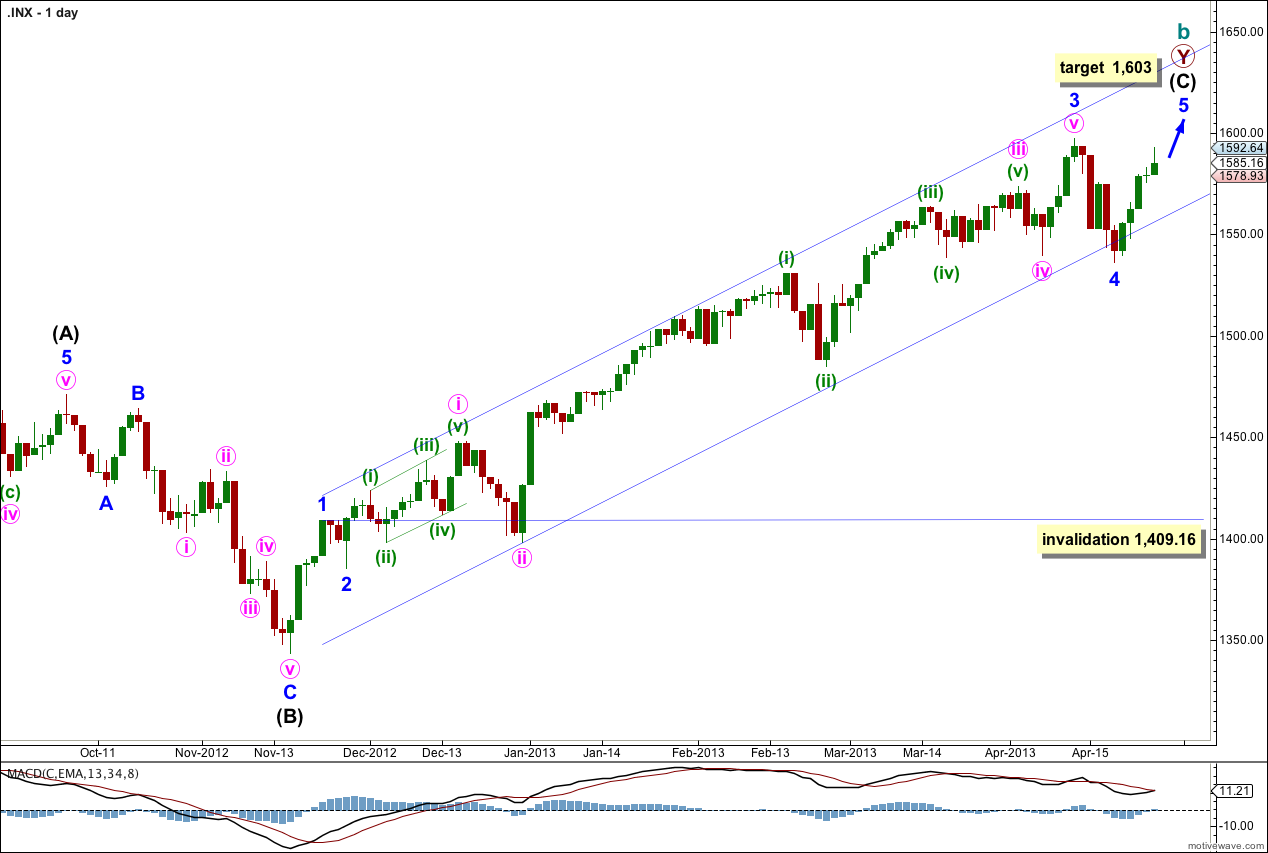
This is my main wave count because we should always assume the trend remains the same, until proven otherwise. We do not have sufficient confirmation of a trend change so we should assume we shall see more upwards movement.
The channel drawn here is a conservative best fit. Draw the first trend line from the highs of minor waves 1 to 3 and push it upwards to enclose all upwards movement. Place a parallel copy upon the low of minute wave ii within minor wave 3. Minor wave 4 should find some support about the lower edge of this channel.
Minor wave 4 may now be complete; it subdivides into a three on the hourly chart. Alternatively, we may move the degree of labeling within it down one degree and only minute wave a within minor wave 4 may have completed. I expect it is most likely to be complete because it is in proportion to other corrections within intermediate wave (C) and it has lasted a Fibonacci 5 days.
There is no Fibonacci ratio between minor waves 1 and 3. This means it is more likely we shall see a Fibonacci ratio between minor wave 5 and either of 1 or 3. At 1,603 minor wave 5 would reach equality with minor wave 1. This is the most likely Fibonacci relationship for minor wave 5 so this target has a good probability.
If minor wave 5 continues for another three days it would have totaled a Fibonacci eight days. It may continue further for another five days to total a Fibonacci thirteen. Please note: Fibonacci time relationships are not as reliable as price. This expectation is a rough guideline, something to look out for, but should not be relied upon.
If it continues further minor wave 4 may not move into minor wave 1 price territory. This wave count is invalidated with movement below 1,409.16.
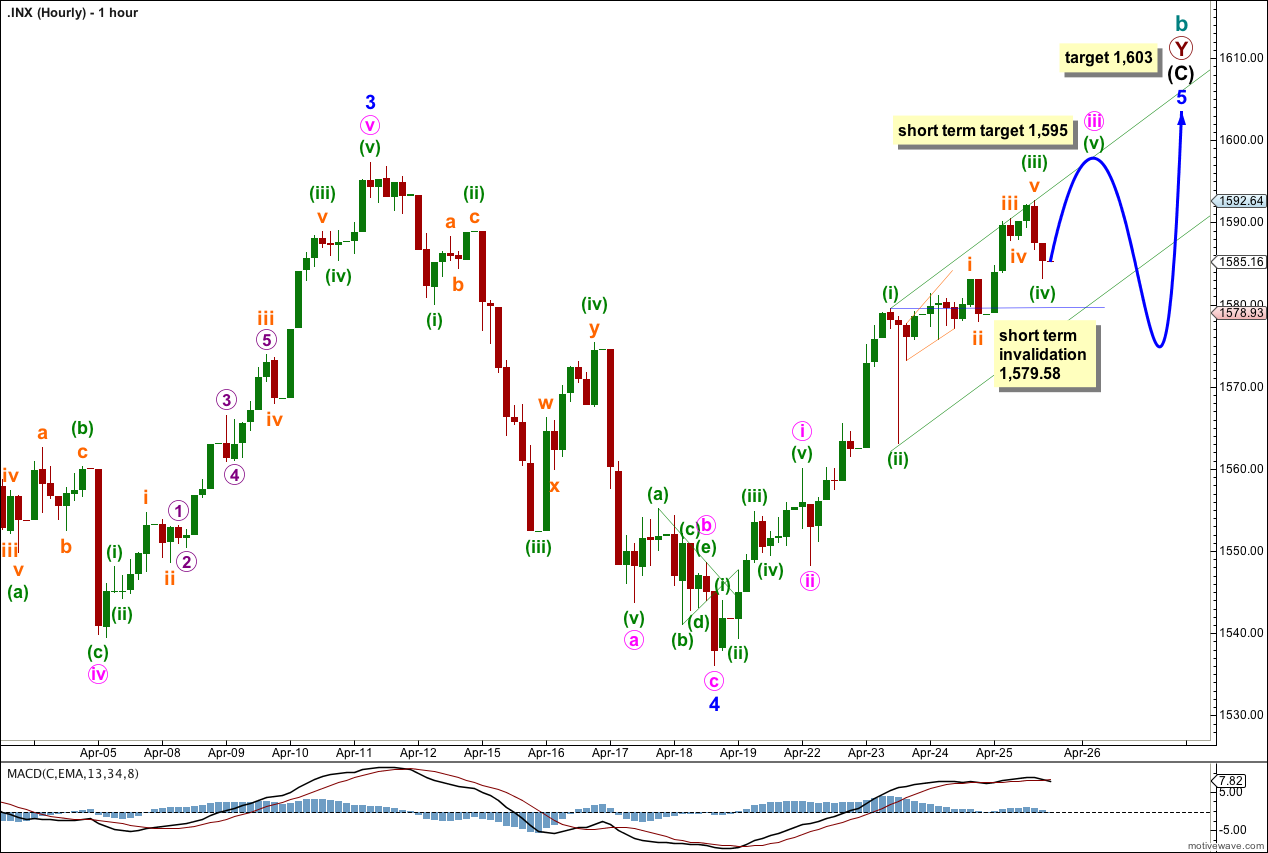
Momentum has increased a little further and so I am adjusting the wave count to fit with this. The strongest momentum should be within a third wave.
Within minor wave 5 minute waves i and ii are complete. Minute wave iii may be extending.
Within minute wave iii we may have just seen the end of minuette waves (iii) and (iv) during Thursday’s session. Minuette wave (iii) is just 1.78 points short of equality with minuette wave (i). This limits the length of minuette wave (v) to no longer than equality with minuette wave (iii), because a third wave may not be the shortest wave.
Ratios within minuette wave (iii) are: subminuette wave iii is just 0.23 points longer than 0.618 the length of subminuette wave i, and subminuette wave v is just 0.06 points short of 0.382 the length of subminuette wave iii.
At 1,595 minuette wave (v) would reach 0.382 the length of minuette wave (i).
I have redrawn the channel about upwards movement using Elliott’s technique about minute wave iii. Draw the first channel from the highs of minuette waves (i) to (iii), then place a parallel copy upon the low of minuette wave (ii). Minuette wave (iv) may remain contained within the channel, and minuette wave (v) may end either midway within the channel or should find resistance about the upper edge.
So far on the five minute chart minuette wave (iv) has a corrective count of seven and so may be over as a shallow 32% correction. This provides nice alternation with minuette wave (ii) which was a deep 53% correction.
If minuette wave (iv) moves further sideways or lower tomorrow then it may not move into minuette wave (i) price territory. This wave count is invalidated at minuette degree with movement below 1,579.58 before minuette wave (v) may be considered complete.
When minuette wave (v) upwards may be seen as complete then the invalidation point must move down to the high of minute wave i at 1,560.10. Minute wave iv may breach the parallel channel as it is drawn here.
Alternate Wave Count.
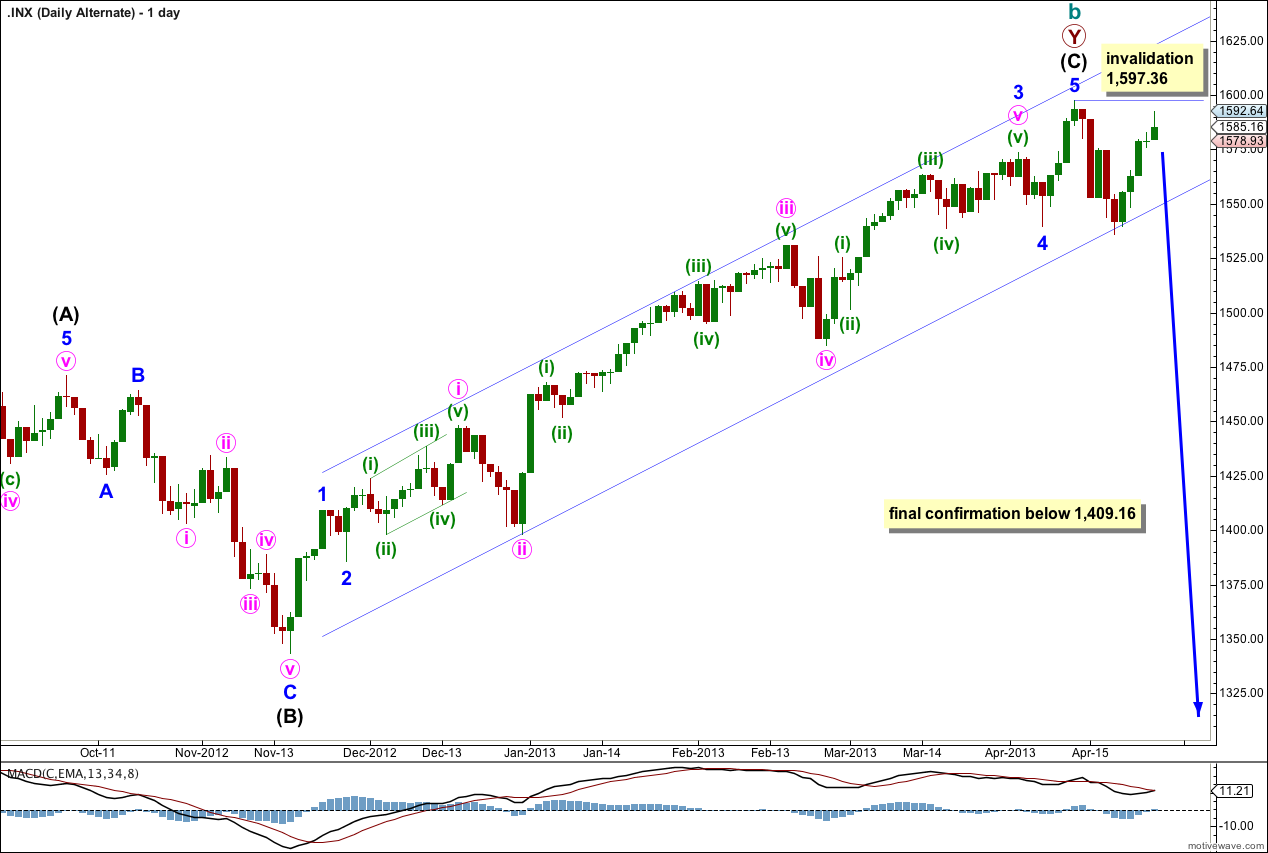
It is again possible that we have seen a trend change, but at this stage we do not have confirmation. There is a hanging man candlestick pattern, but this is an indicator only and not a reversal pattern.
This wave count agrees with MACD as an indicator of momentum. The strongest piece of movement is minuette wave (iii) within minute wave iii within minor wave 3, the very middle of the third wave.
The channel here is drawn the same as on the main daily wave count. I want to see a clear channel breach, with the most conservatively drawn channel (as this one is) before I have any confidence whatsoever in a possible trend change.
Final confirmation would come with invalidation of the main wave count with price movement below 1,409.16. At that stage we may have confidence that the S&P 500 should be in a new downwards trend to last one to several years and take price substantially below 666.76.
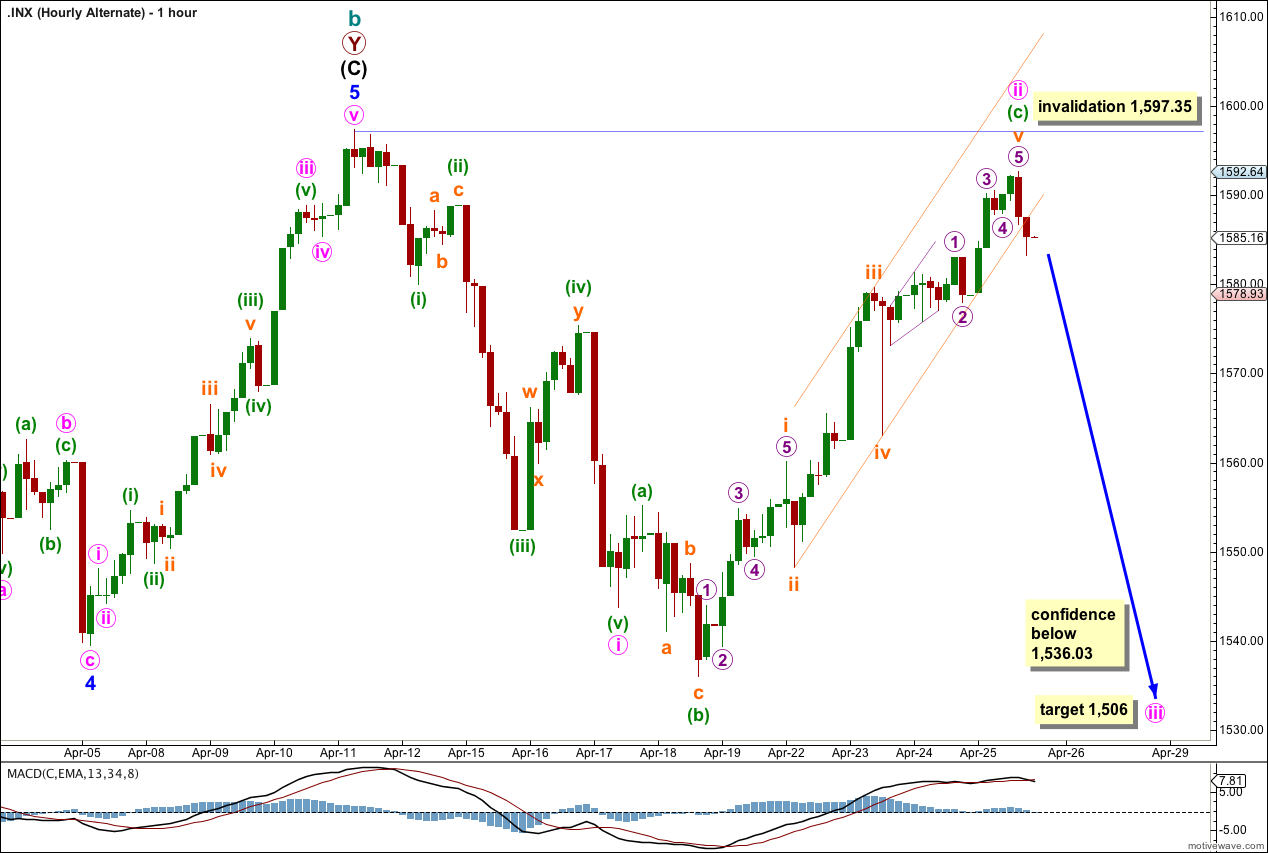
Upwards movement for minuette wave (c) subdivides nicely into an impulse. There is now no Fibonacci ratio between minuette waves (a) and (c). The extreme length of minuette wave (c) in relation to minuette wave (a) gives this expanded flat an odd look and reduces the probability of this alternate wave count further.
If we saw movement below 1,536.03 then we may have confidence in the target at 1,506 where minute wave iii would reach 1.618 the length of minute wave i.
Minute wave ii may not move beyond the start of minute wave i. This wave count is firmly invalidated with movement above 1,597.35.