
Yesterday’s analysis expected upwards movement to a minimum target at 1,592.85 for the main wave count, before downwards movement to a new low below 1,552.35.
We did not get any upwards movement, but price moved to a new low.
The structure for this fourth wave correction is unlikely to be a flat, and so the wave count is adjusted. Apart from what corrective structure may be unfolding the wave count remains the same at the daily chart level.
The alternate wave count still requires confirmation before we may have any confidence in it.
Click on the charts below to enlarge.
Main Wave Count.
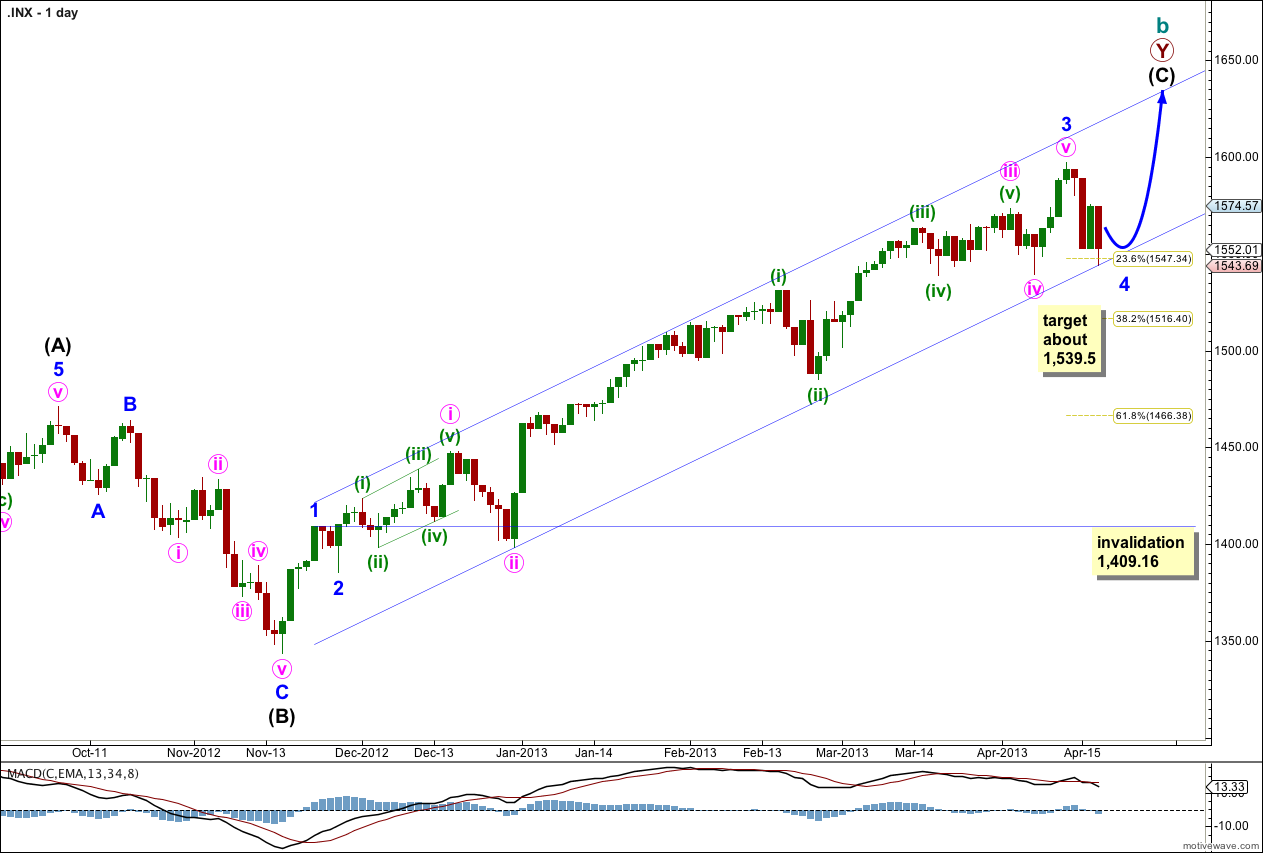
This is my main wave count because we should always assume the trend remains the same, until proven otherwise. We do not have confirmation of a trend change so we should assume we shall see more upwards movement.
The channel drawn here is a conservative best fit. Draw the first trend line from the highs of minor waves 1 to 3 and push it upwards to enclose all upwards movement. Place a parallel copy upon the low of minute wave ii within minor wave 3. Minor wave 4 should find some support about the lower edge of this channel.
At this early stage we may expect minor wave 4 is incomplete and may end about the fourth wave of one lesser degree; minute wave iv ended at 1,539.5.
Minor wave 2 was a shallow (36%) zigzag correction. Minor wave 4 would most likely be a flat and may or may not exhibit alternation in depth.
Minor wave 4 may not move into minor wave 1 price territory. This wave count is invalidated with movement below 1,409.16.
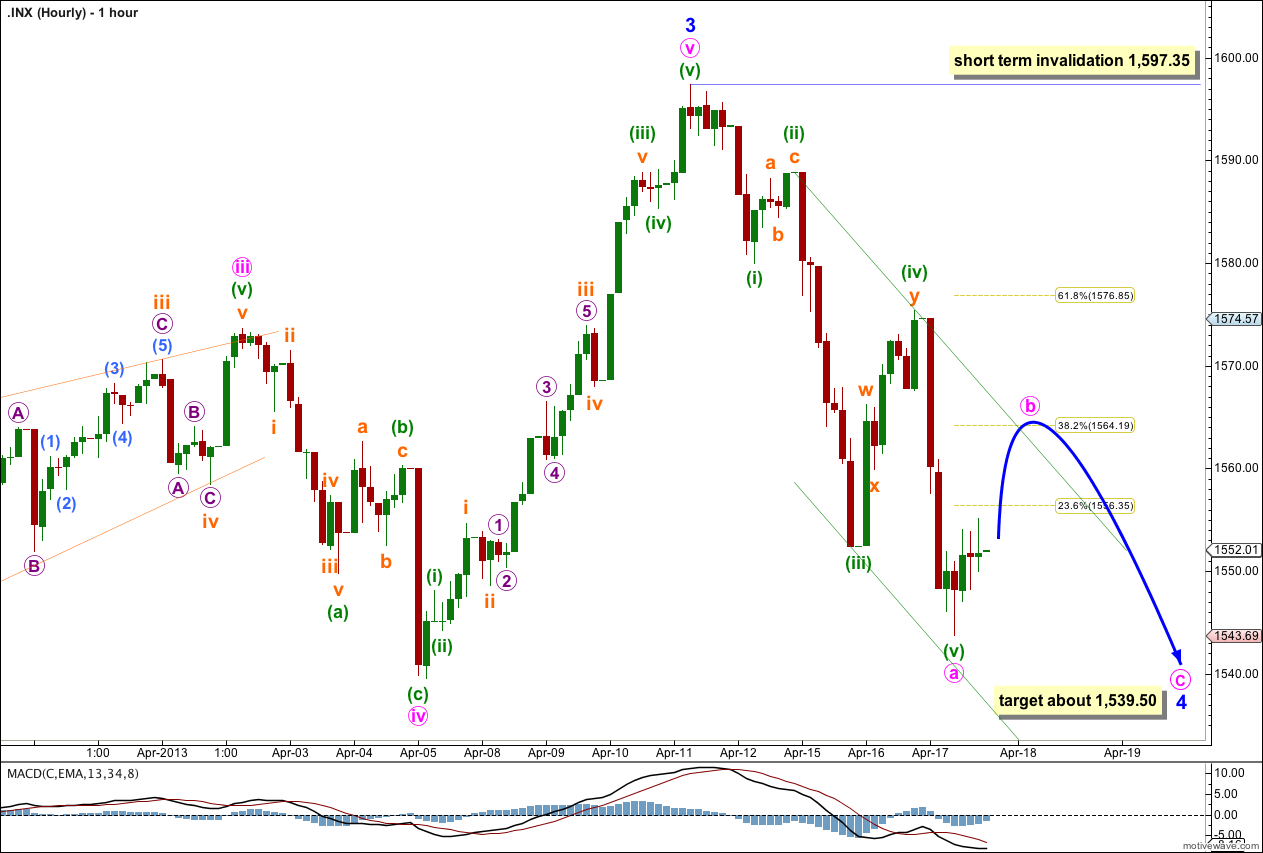
With price failing to reach 1,592.85 and simply turning lower, we now have a clear five down on the hourly chart. Minor wave 4 may not exhibit alternation in structure with minor wave 2. wave 4 may be unfolding as a zigzag too. This structure was less likely than a flat, but is certainly possible.
With a five down on the hourly chart minor wave 4 may be subdividing as a 5-3-5 zigzag.
Within the zigzag minute wave b would be most likely to end about the 0.382 Fibonacci ratio of minute wave a at 1,564.19. If it does not end there the next expectation would be at the 0.618 Fibonacci ratio at 1,576.85.
When minute wave b is a complete three wave structure then we should expect minute wave c to end below the end of minute wave a at 1,543.69 to avoid a truncation.
Minute wave b may not move beyond the start of minute wave a. This wave count is invalidated with movement above 1,597.35 while minor wave 4 is incomplete.
Alternate Wave Count.
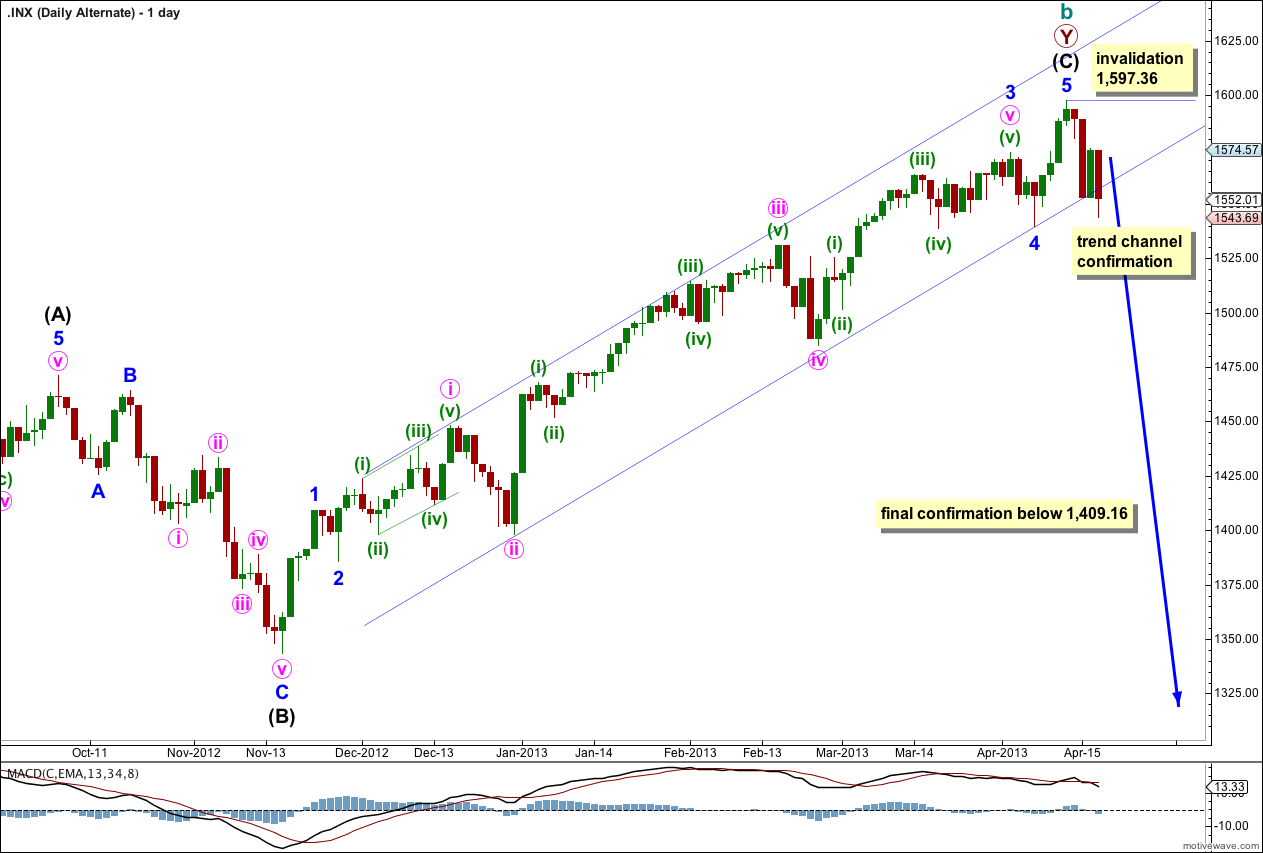
It is again possible that we have seen a trend change, but at this early stage we have no confirmation. There is no candlestick reversal pattern here.
This wave count agrees with MACD as an indicator of momentum. The strongest piece of movement is minuette wave (iii) within minute wave iii within minor wave 3, the very middle of the third wave.
The channel drawn here is a conservative best fit. Draw the first trend line from the low of minute wave ii within minor wave 3 to the low of minor wave 4, then place a parallel copy on the high of minute wave i within minor wave 3. So far the channel is just slightly overshot, and not breached.
For this alternate wave count to have initial confirmation we would need to see a full daily candlestick below the channel and not touching the lower trend line. At that stage I would switch wave counts over and this would be my main wave count. Until we have confirmation this wave count should be considered as a possibility but may not be relied upon.
Final confirmation would come with invalidation of the main wave count with price movement below 1,409.16. At that stage we may have confidence that the S&P 500 should be in a new downwards trend to last one to several years and take price substantially below 666.76.
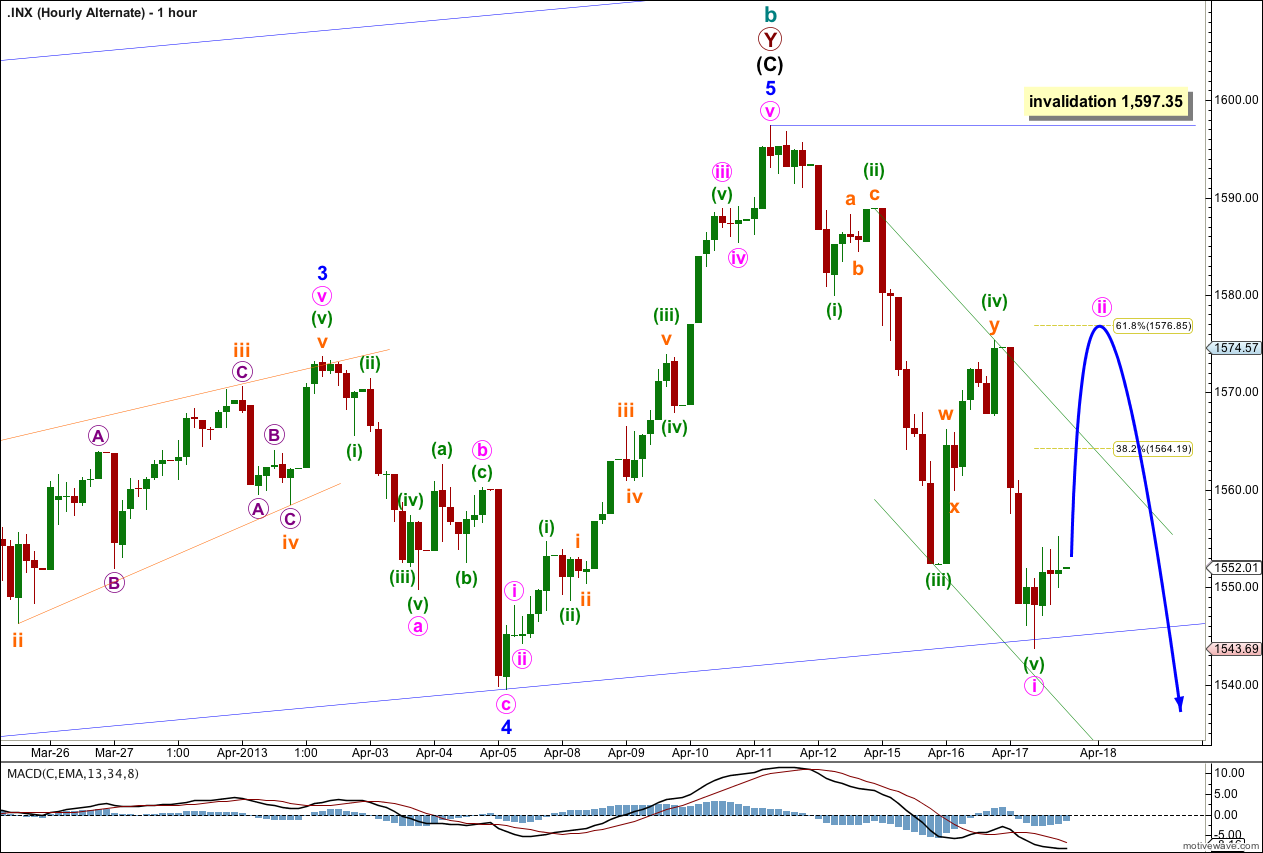
So far we now have a clear five down on the hourly chart. This may be minute wave i of the new trend.
I would expect minute wave ii to end either at the 0.382 Fibonacci ratio, or more likely at the 0.618 Fibonacci ratio. It should breach the parallel channel drawn here around minute wave i down.
When minute wave ii is complete we should expect momentum downwards to increase as minute wave iii unfolds.
Minute wave ii may not move beyond the start of minute wave i. This wave count is invalidated with movement above 1,597.35.
Brought under the SMA(50) today at 1532 // looks like a “B” wave into 1576 to make the right shoulder next week?? OR Expanding Triangle pushing us into 1700 into June // looks like an easy ride up 30+ points to start ??