
Yesterday’s analysis expected Tuesday’s session to begin with a little more downwards movement to a short term target at 1,543, before price turned back upwards. There was no downwards movement, but price has moved upwards and remains below the invalidation point for the alternate hourly wave count.
Both wave counts remain valid. The main wave count should be used because we have no confirmation of a trend change.
Click on the charts below to enlarge.
Main Wave Count.
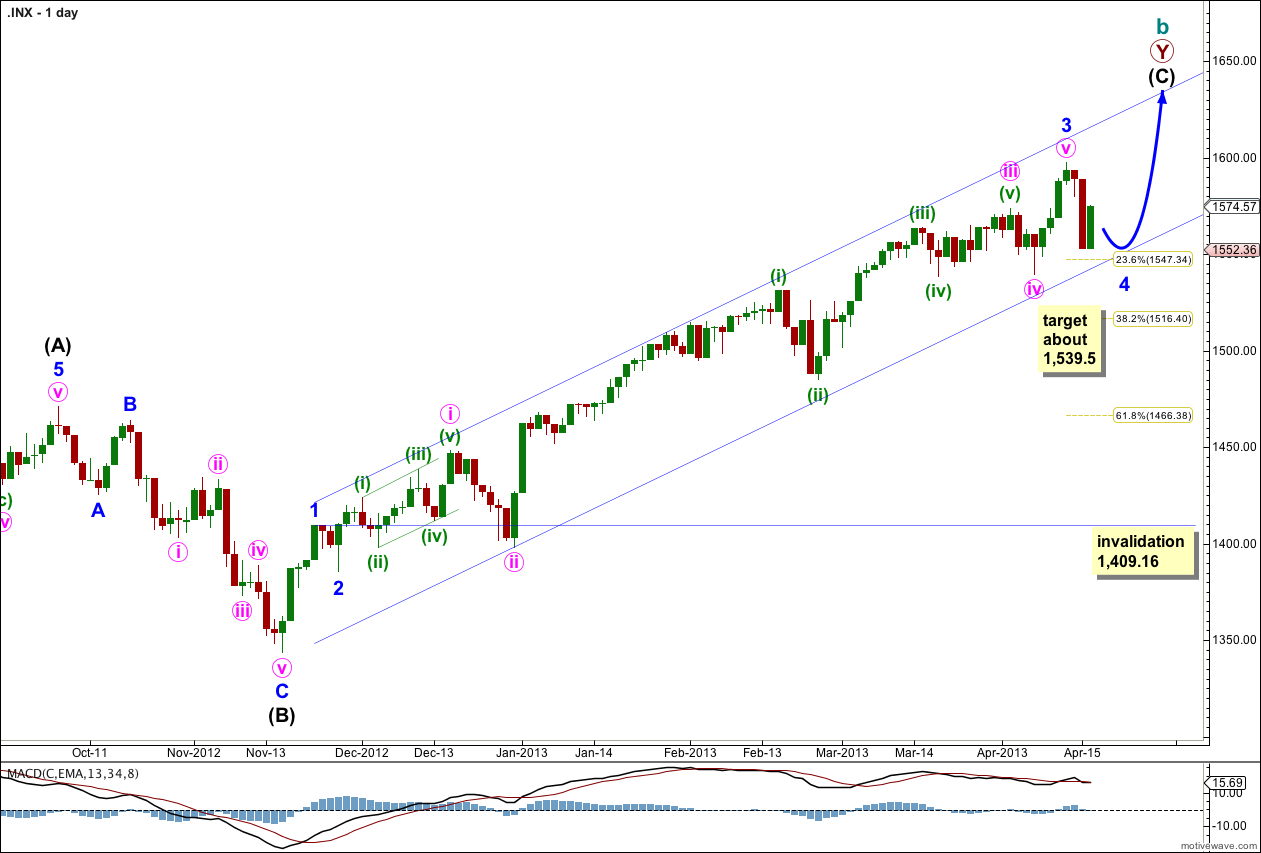
This is my main wave count because we should always assume the trend remains the same, until proven otherwise. We do not have confirmation of a trend change so we should assume we shall see more upwards movement.
The channel drawn here is a conservative best fit. Draw the first trend line from the highs of minor waves 1 to 3 and push it upwards to enclose all upwards movement. Place a parallel copy upon the low of minute wave ii within minor wave 3. Minor wave 4 should find some support about the lower edge of this channel.
At this early stage we may expect minor wave 4 is incomplete and may end about the fourth wave of one lesser degree; minute wave iv ended at 1,539.5.
Minor wave 2 was a shallow (36%) zigzag correction. Minor wave 4 would most likely be a flat and may or may not exhibit alternation in depth.
Minor wave 4 may not move into minor wave 1 price territory. This wave count is invalidated with movement below 1,409.16.
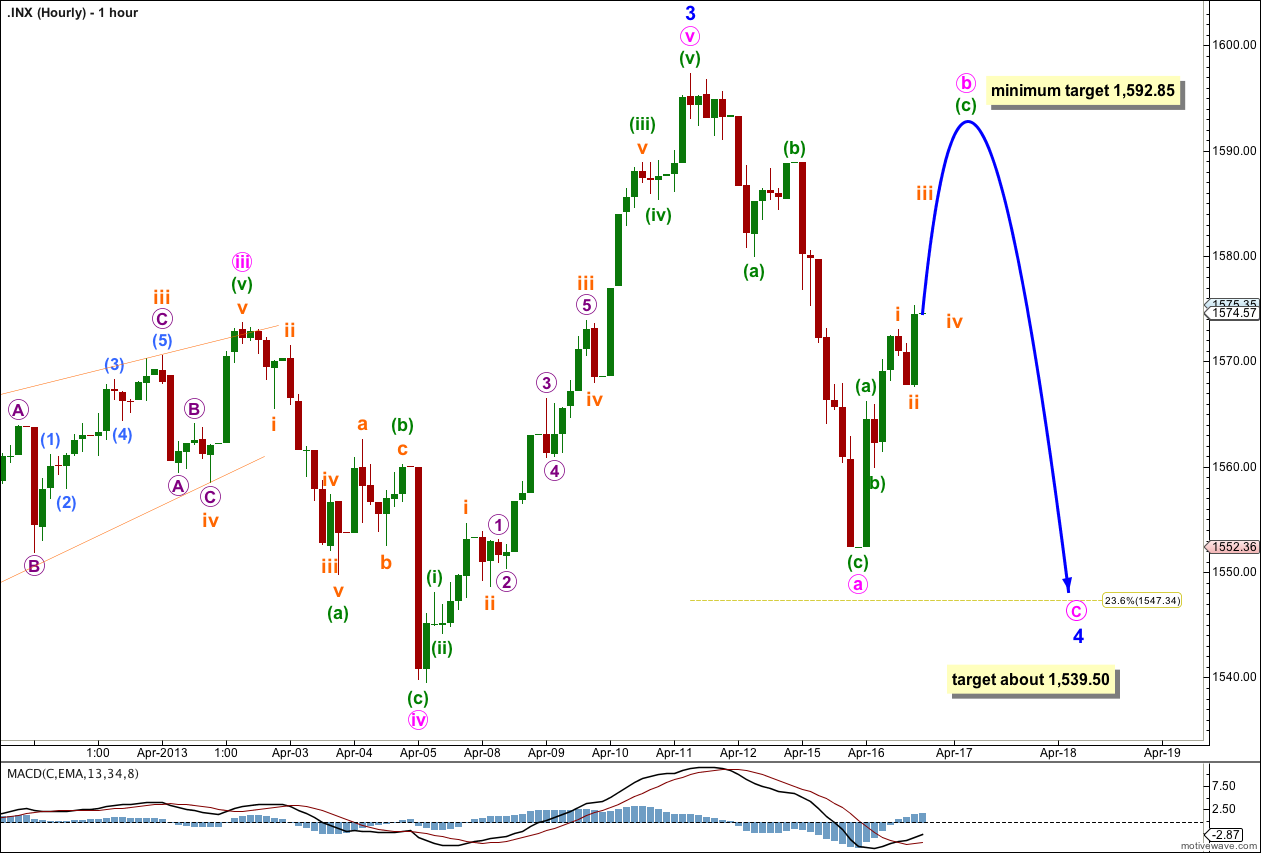
Minute wave a was completed and Tuesday’s upwards movement may be minute wave b which is incomplete.
If minor wave 4 is unfolding as a flat correction then minute wave b within it must reach at least 90% the length of minute wave a at 1,592.85. Minute wave b may make a new price high above the start of minute wave a, and is reasonably likely to do so as the most common type of flat is an expanded flat where minute wave b would have to reach up to 1,599.60 or above.
When minute wave b is a completed three wave structure we may expect a trend change and downwards five wave movement for minute wave c. Minute wave c is extremely likely to make a new low below the end of minute wave a at 1,552.38 to avoid a truncation and a rare running flat.
If this upwards movement labeled minute wave b fails to reach 1,592.85 or above then minor wave 4 may be unfolding as a double zigzag or double combination. I would relabel minute wave a to minute wave w, and upwards movement would be minute wave x. A second corrective structure would be labeled minute wave y and must unfold as a three.
Alternate Wave Count.
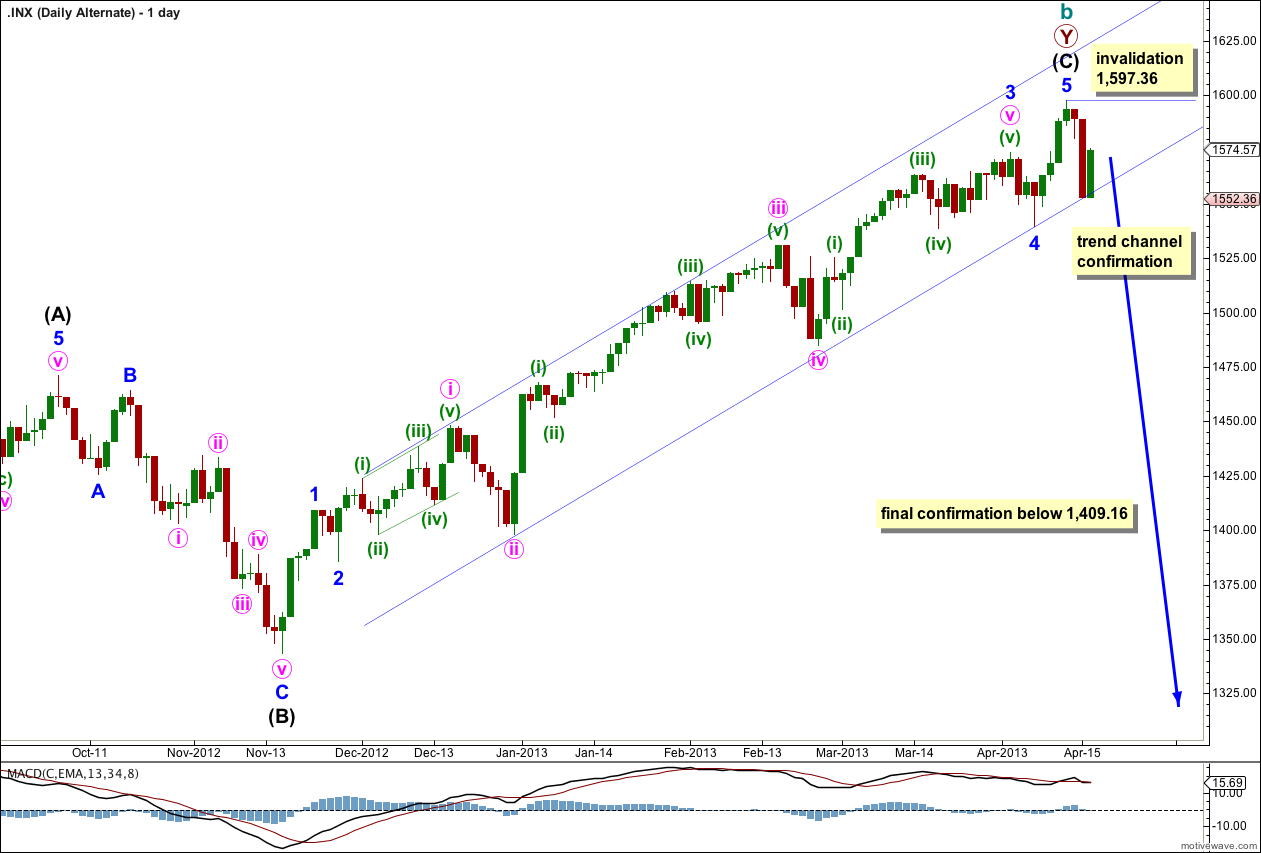
It is again possible that we have seen a trend change, but at this early stage we have no confirmation. There is no candlestick reversal pattern here.
This wave count agrees with MACD as an indicator of momentum. The strongest piece of movement is minuette wave (iii) within minute wave iii within minor wave 3, the very middle of the third wave.
The channel drawn here is a conservative bet fit. Draw the first trend line from the low of minute wave ii within minor wave 3 to the low of minor wave 4, then place a parallel copy on the high of minute wave i within minor wave 3. This channel contains all movement so far. We may see price find some support about the lower trend line before downwards movement breaks through.
For this alternate wave count to have initial confirmation we would need to see a full daily candlestick below the channel and not touching the lower trend line. At that stage I would switch wave counts over and this would be my main wave count. Until we have confirmation this wave count should be considered as a possibility but may not be relied upon.
Final confirmation would come with invalidation of the main wave count with price movement below 1,409.16. At that stage we may have confidence that the S&P 500 should be in a new downwards trend to last one to several years and take price substantially below 666.76.
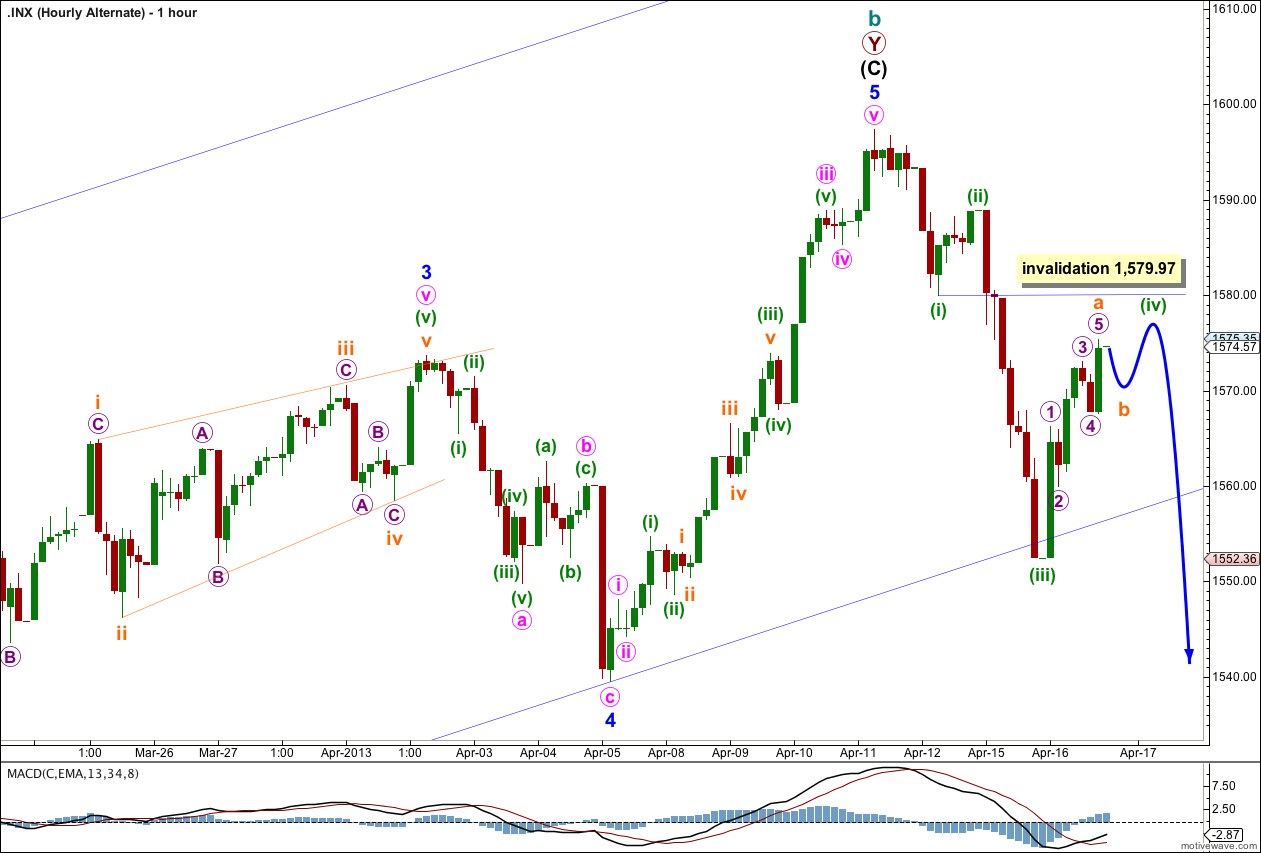
So far we do not have a clear five down on the hourly chart which would be required to have any confidence in a trend change.
If this is a new downwards trend then the first wave down is most likely to unfold as an impulse, but may also be a leading diagonal. These are the only two possible structures for a first wave. This wave count looks at the more likely impulse.
Minuette wave (iii) has no Fibonacci ratio to minuette wave (i). If this wave count remains valid then minuette wave (v) would be more likely to exhibit a Fibonacci ratio to either of minuette waves (i) or (iii).
Upwards movement may be minuette wave (iv) which is incomplete. Minuette wave (ii) was a deep zigzag correction so I would expect minuette wave (iv) to be shallow, but it is not. This lack of alternation in depth slightly reduces the probability of this wave count.
Minuette wave (iv) may not move into minuette wave (i) price territory. This wave count is invalidated with movement above 1,579.97.
If this wave count is invalidated with upwards movement then I would look at the less likely possibility that a leading diagonal is unfolding. The invalidation point would move up to 1,597.35.