
Last analysis expected price to rise further for a few days or so. However, downwards movement has invalidated both hourly wave counts.
I have two wave counts for you today. We may use confirmation / invalidation points to work with these two counts. We should always assume the trend remains the same until proven otherwise, “the trend is your friend”. So the main wave count expects the trend to continue.
Click on the charts below to enlarge.
Main Wave Count.
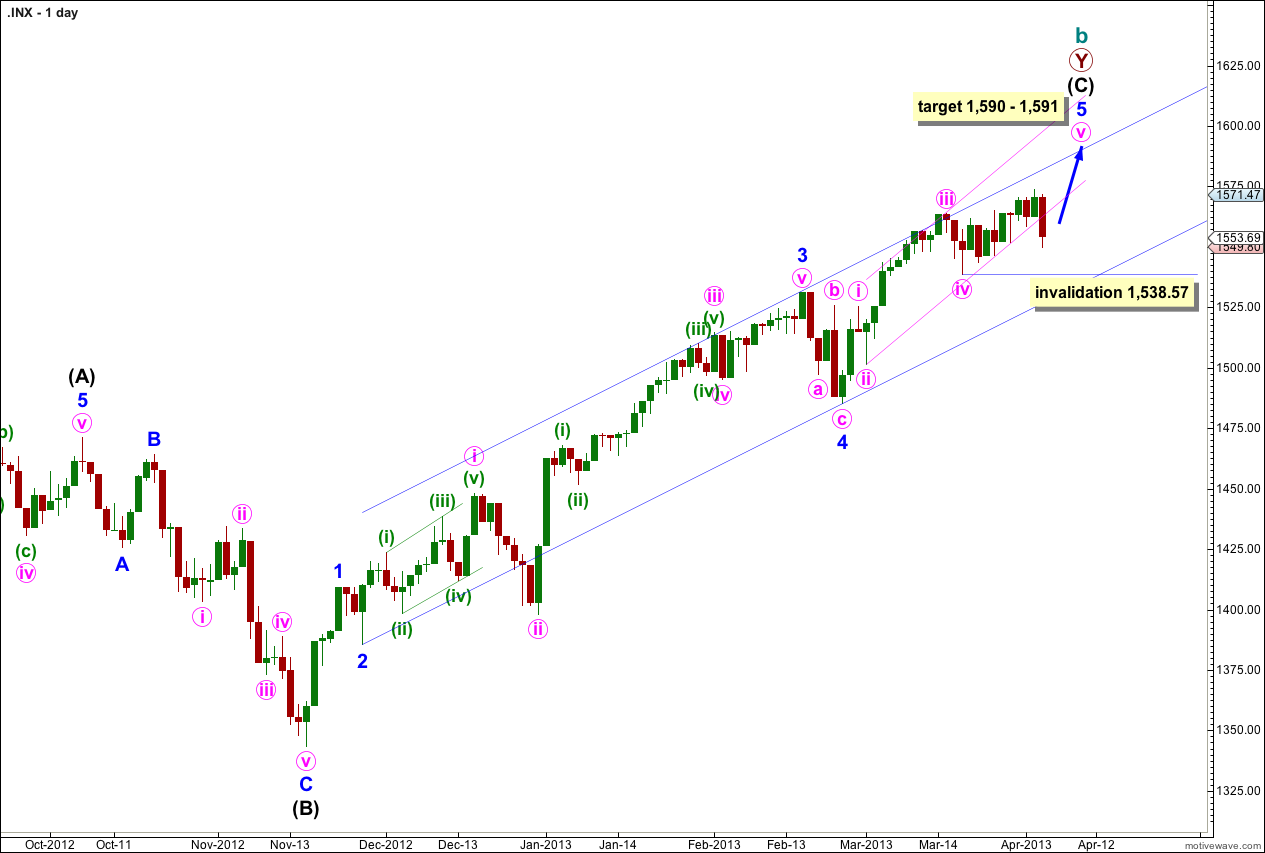
This structure is nearing completion. Cycle wave b is a double zigzag and the end of the second zigzag is nearly over. Intermediate wave (C) is unfolding as a simple impulse and remains recently contained within its trend channel. Price may find resistance at the upper end of this channel. Draw it first with a trend line from the lows of minor waves 2 to 4, then place a parallel copy upon the high of minor wave 3.
Cycle wave b is now 105% the length of cycle wave a and so this structure at super cycle degree is an expanded flat correction, the most common type of flat.
At 1,590 intermediate wave (C) would reach 0.618 the length of intermediate wave (A). At 1,591 minor wave 5 would reach 1.618 the length of minor wave 1.
When price reaches this target zone we will use an alternate wave count to see if the structure could be complete and a trend change could occur.
Movement below the channel containing intermediate wave (C) would be initial confirmation of a trend change. While price remains within this channel we shall expect more upwards movement.
Within minute wave v no second wave correction may move beyond the start of its first wave. This wave count is invalidated with movement below 1,538.57.
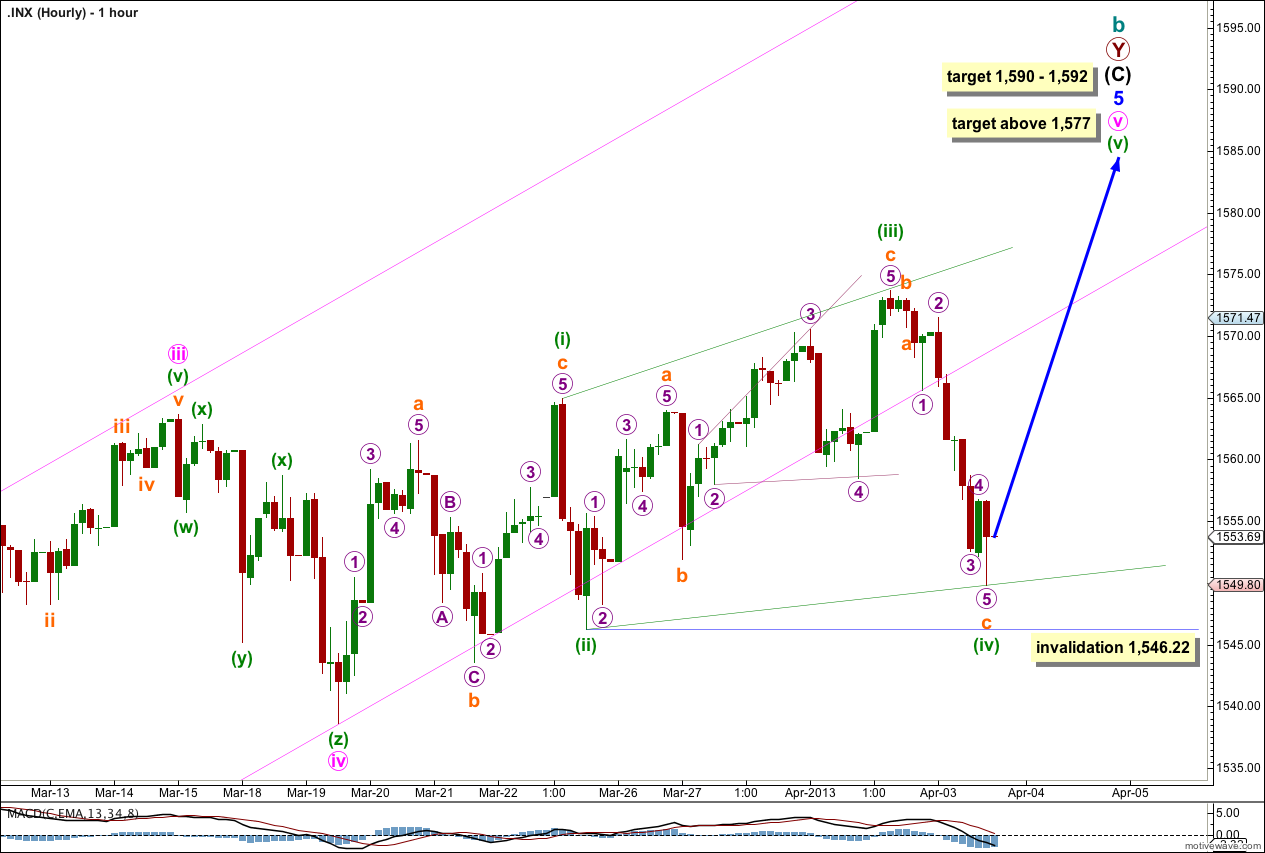
If minute wave iv was a triple zigzag then minute wave v may have begun at 1,538.57.
With all the overlapping movement within minute wave v this structure is likely to be an ending diagonal. All the subwaves must subdivide as zigzags, including the third wave.
Minuette wave (iii) is longer than minuette wave (i), and minuette wave (iv) is longer than minuette wave (ii). The diagonal is expanding. Minuette wave (v) should be longer than minuette wave (iii) which means it should reach to 1,577 or above.
Within a diagonal the fourth wave should overlap into the first wave price territory. Minuette wave (iv) may not move beyond the end of minuette wave (ii). This wave count is invalidated at minuette wave degree with movement below 1,546.22.
Alternate Wave Count.
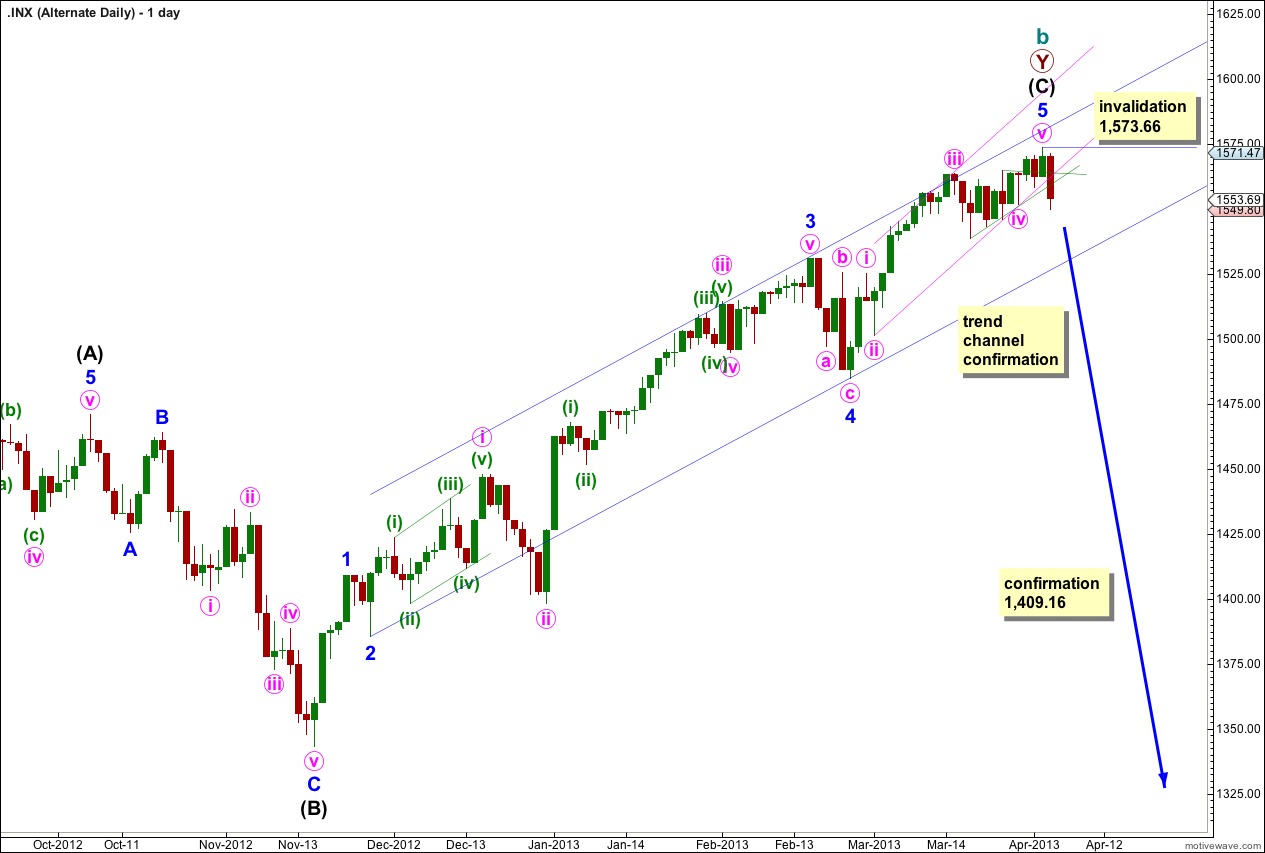
It is possible that we have seen a trend change from the first target zone which was 1,573 to 1,575. Because we have no confirmation of this trend change this will be an alternate wave count.
There is now a bearish engulfing candlestick pattern for the last two days indicating a trend change.
If cycle wave b is over it is 105% the length of cycle wave a, so at super cycle degree an expanded flat is unfolding. This would expect cycle wave c to be extremely likely to take price to new lows below the end of cycle wave a at 666.79, and to last one to several years. Because this is an extremely big trend change it is wise to wait for some confirmation before having any confidence in this wave count.
Intermediate wave (C) is 16.73 points short of 0.618 the length of intermediate wave (A). This is a 7.3% variation, less than 10% may be considered acceptable.
Ratios within intermediate wave (C) are: minor wave 3 has no Fibonacci ratio to minor wave 1, and minor wave 5 is just 1.28 points short of 0.618 the length of minor wave 3.
Ratios within minor wave 5 are: minuete wave iii is 3.11 points short of 1.618 the length of minute wave i, and minute wave v is 1.98 points short of 0.382 the length of minute wave iii.
Minute waves ii and iv show perfect alternation; minute wave ii is a relatively deep zigzag and minute wave iv is a shallow triangle.
Initially we need to see the main wave count invalidated with movement below 1,538.57 to have any confidence at all in this wave count. Movement below the channel drawn about intermediate wave (C) would give some more confidence in this wave count.
Final full confirmation would come with price movement below 1,409.16 as at that stage downwards movement could not be just a fourth wave correction within intermediate wave (C) and so it would have to be over.
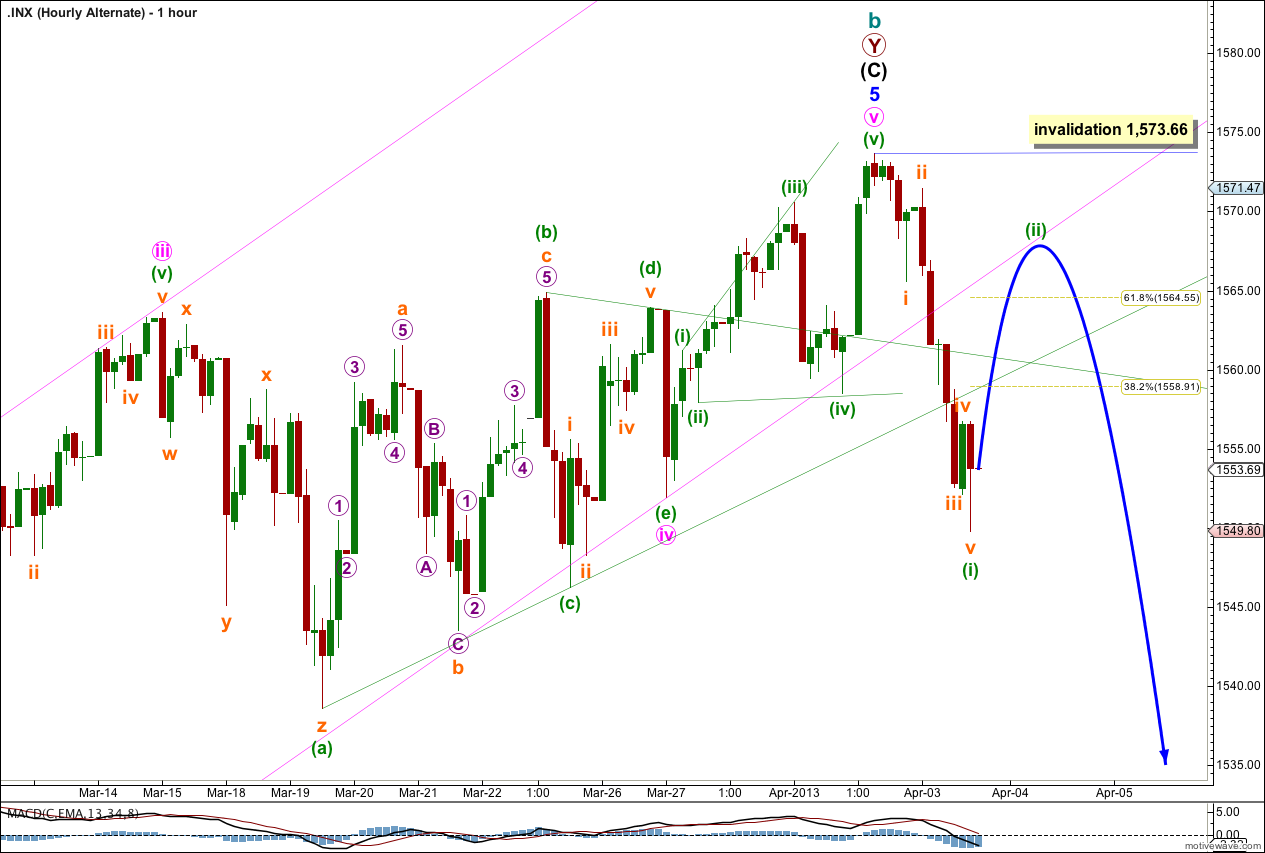
This wave count has a good fit with a triangle in the fourth wave position for minute wave iv.
The parallel channel containing minor wave 5 is clearly breached by this downwards movement. This is an early indication of a possible trend change.
It is possible that minute wave v was a brief ending expanding diagonal, and that yesterday’s labeling of this structure was wrong.
To the downside Wednesday’s movement subdivides best on the five minute chart as a five wave impulse. The overlapping within subminuette wave i does make this movement slightly ambiguous though.
Ratios within minuette wave (i) are: subminuette wave iii has no Fibonacci ratio to subminuette wave i, and subminuette wave v is 0.45 short of 0.382 the length of subminuette wave iii.
If we have a five down then we should expect an upwards correction. We may expect minuette wave (ii) to end about the 0.618 Fibonacci ratio of minuette wave (i) at 1,564.55, or to find resistance about the lower end of the parallel channel containing minor wave 5.
Minuette wave (ii) may not move beyond the start of minuette wave (i). This wave count is invalidated with movement above 1,573.66.