
Last analysis expected the new week to begin with a little downwards movement before price turned upwards to make new highs. Downwards movement breached the nearby invalidation point on the hourly chart, but has not been enough to confirm the alternate wave count.
Click on the charts below to enlarge.
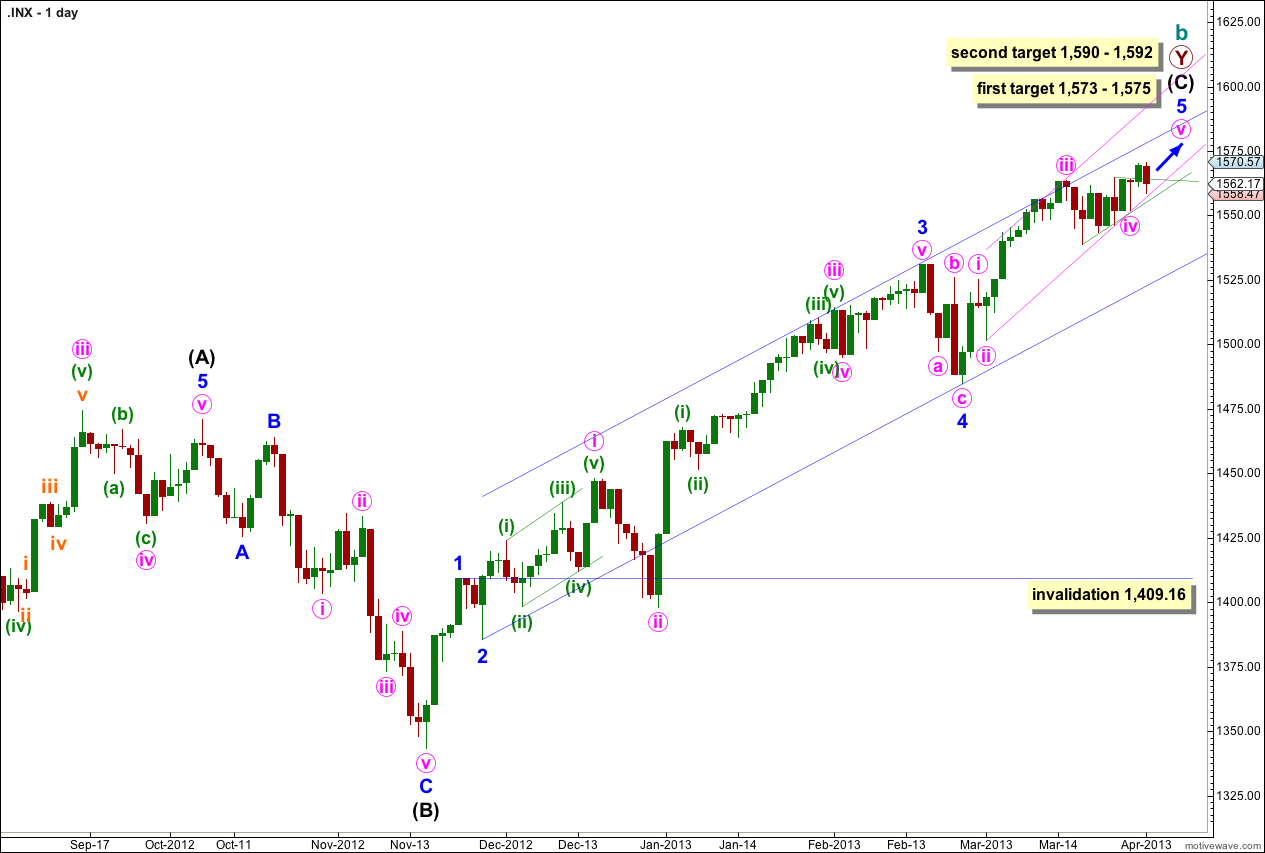
The structure is within the second zigzag of a double labeled primary wave Y. Within this second zigzag intermediate wave (C) may be incomplete.
Within intermediate wave (C) minor waves 1 through to 4 are most likely complete. We may use Elliott’s channeling technique to draw a channel about the impulse of intermediate wave (C). Draw the first trend line from the lows of minor waves 2 to 4, then place a parallel copy upon the high of minor wave 3. At this stage it looks like minor wave 5 may end about the upper edge of this channel.
At 1,573 cycle wave b would reach 105% the length of cycle wave a. This is the minimum requirement for a B wave in relation to an A wave within an expanded flat, and as expanded flats are the most common type of flat this price point has a good probability of being reached.
At 1,575 minor wave 5 would reach 0.618 the length of minor wave 3.
If price continues to move higher through the first target then we may use the second target. At 1,590 intermediate wave (C) would reach 0.618 the length of intermediate wave (A). At 1,591 minor wave 5 would reach 1.618 the length of minor wave 1. At 1,592 minute wave v would reach equality in length with minute wave i. This gives us a high probability two point target based upon three wave degrees.
Within intermediate wave (C) minor wave 4 may not move into minor wave 1 price territory. This wave count is invalidated with movement below 1,409.16.
Within intermediate wave (C) minor wave 1 has no Fibonacci duration lasting 4 days, minor wave 2 lasted a Fibonacci 3 days, minor wave 3 lasted a Fibonacci 55 days, and minor wave 4 lasted a Fibonacci 5 days. So far minor wave 5 has lasted 23 days and looks like it may not have a Fibonacci time relationship. A further 11 sessions would take it to a Fibonacci 34.
The next possible Fibonacci date for minor wave 5 would be 17th April. Alternatively, it may end with no Fibonacci time relationship.
At intermediate degree wave (C) has so far lasted 90 sessions, one day longer than a Fibonacci 89 and an acceptable variation. If it does not end here then it is unlikely to have a Fibonacci time relationship.
The main hourly wave count assumes the trend remains upwards because we have no confirmation at this stage of a trend change.
Main Hourly Wave Count.
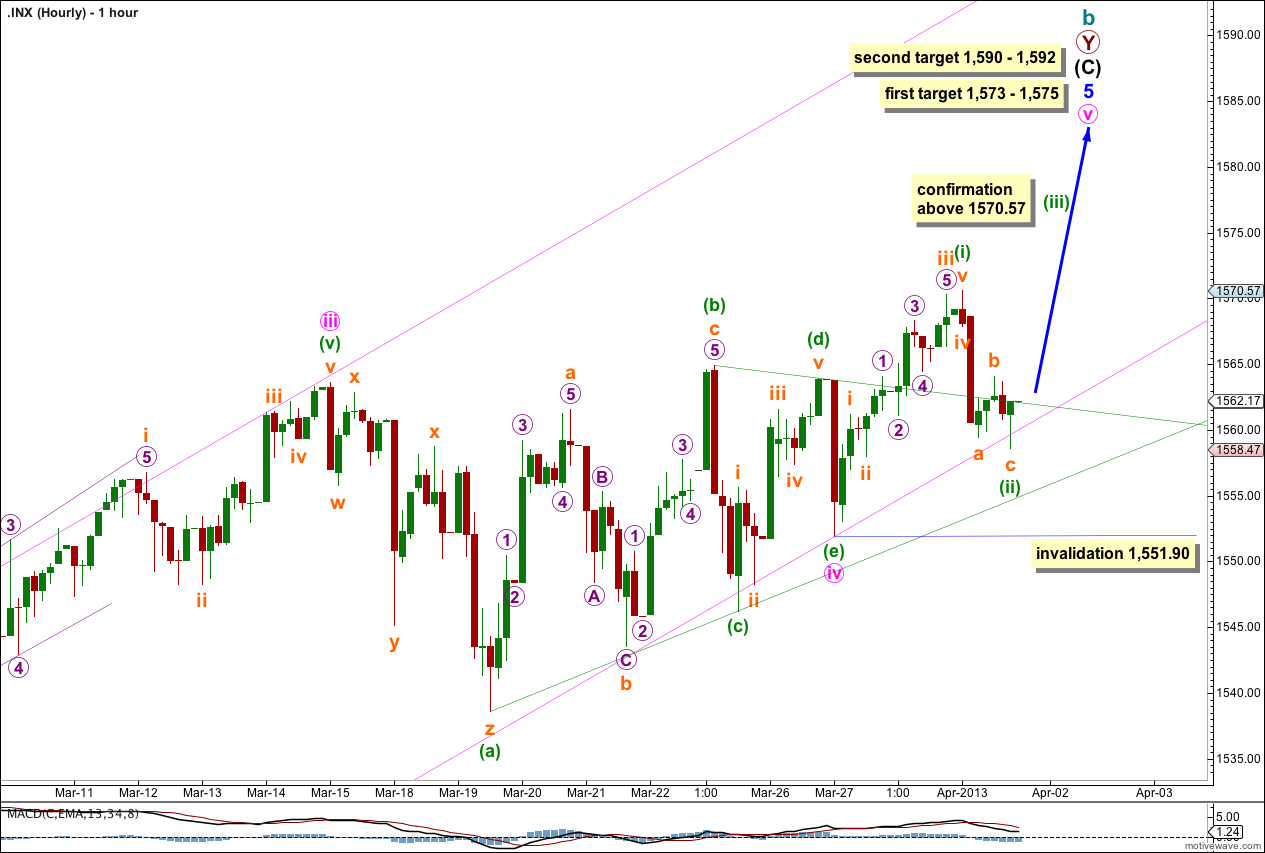
The new week began with a very slight new high. This last upwards wave on the five minute chart may have been the final fifth wave of minuette wave (i) upwards.
Ratios are calculated from analysis of the five minute chart.
Ratios within minuette wave (i) are: subminuette wave iii is just 0.38 short of 1.618 the length of subminuette wave i, and subminuette wave v has no Fibonacci ratio to subminuette waves i or iii.
Ratios within subminuette wave iii are: micro wave 3 has no Fibonacci ratio to micro wave 1, and micro wave 5 is just 0.25 points short of equality with micro wave 3.
So far downwards movement from the new high subdivides nicely into a 5-3-5 zigzag on the five minute chart. This may be a second wave correction. If this main wave count is correct then we should see an increase in upwards momentum tomorrow which must make a new high because minuette wave (iii) must move beyond the end of minuette wave (i). Movement above 1,570.57 would confirm this main wave count and invalidate the alternate.
Minuette wave (ii) may not move beyond the start of minuette wave (i). This wave count is invalidated with movement below 1,551.90.
Alternate Hourly Wave Count.
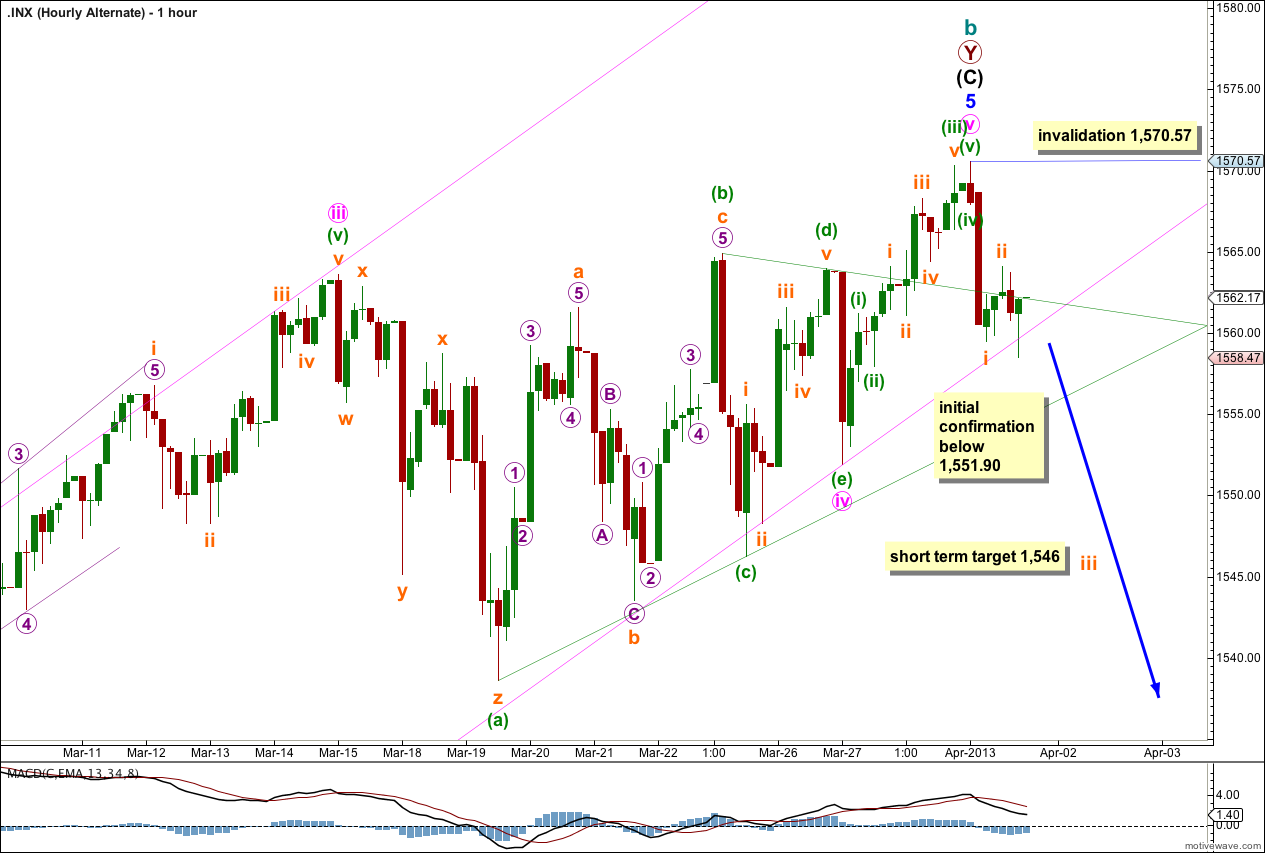
By simply moving the degree of labeling within the last upwards wave all up one degree we may have seen a trend change during Monday’s session. We need to see a clear channel breach of the wider blue channel on the daily chart to have any confidence in this possible trend change.
Intermediate wave (C) would be 17.63 points longer than 0.618 the length of intermediate wave (A), a 7.8% variation which is acceptable. Intermediate wave (C) would have lasted just one day longer than a Fibonacci 89 days, also an acceptable variation.
Ratios within intermediate wave (C) are: minor wave 3 has no Fibonacci ratio to minor wave 1, and minor wave 5 is just 4.36 points short of 0.618 the length of minor wave 3.
Ratios within minor wave 5 are: minute wave iii is 3.11 points short of 1.618 the length of minute wave i, and minute wave v has no Fibonacci ratio to either of minute waves i or iii.
Movement below 1,551.90 would provide an initial indication that this alternate wave count may be correct. We would still need to see a clear channel breach on the daily chart to have any confidence in a trend change. Finally, movement below 1,409.16 would confirm we are in a new trend to last several years and take price to new lows.