
Last analysis expected a triangle to end for a fourth wave correction to be followed by more upwards movement to new highs. The triangle as I had it labeled on last week’s hourly chart was incorrect and was invalidated. However, a triangle did complete. The triangle was longer lasting than originally labeled and was followed by upwards movement.
Click on the charts below to enlarge.
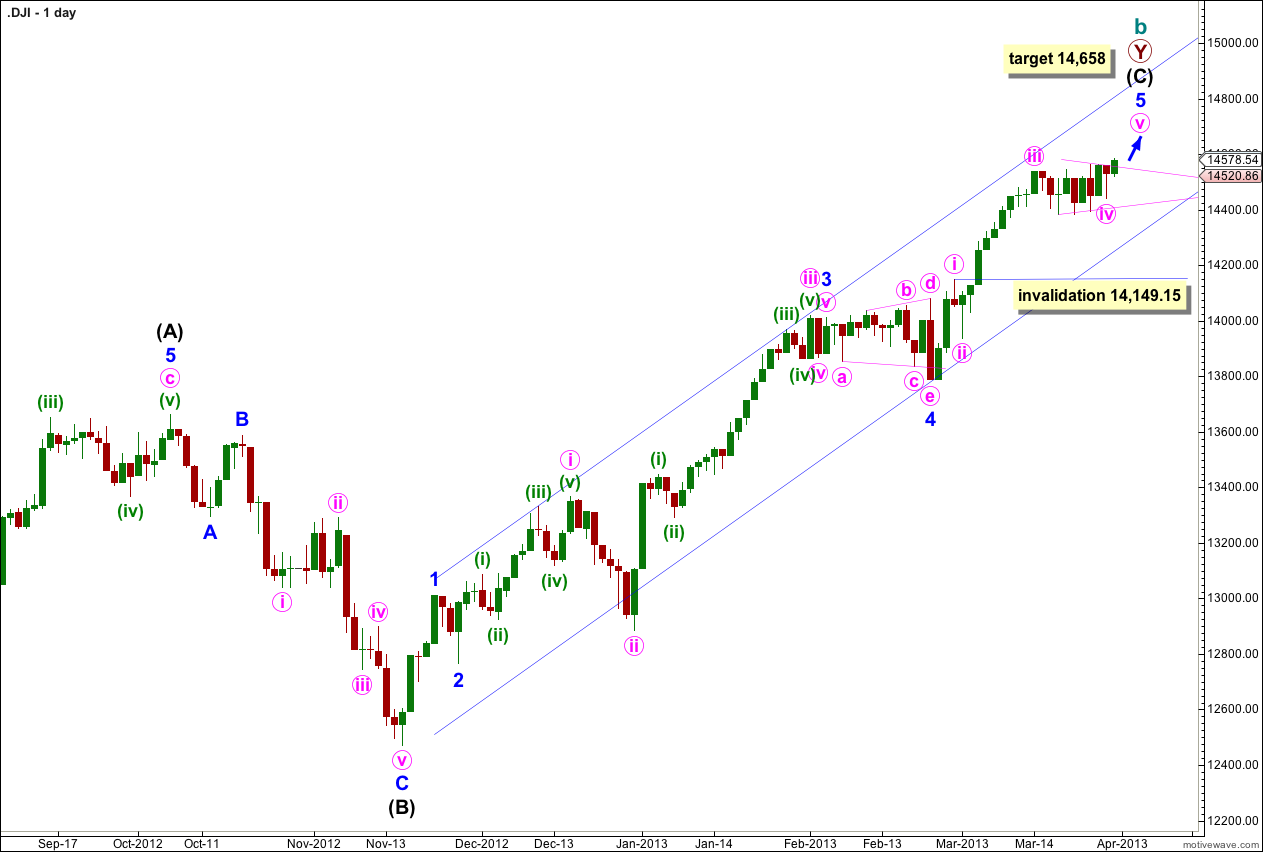
The daily chart shows the structure of intermediate wave (C) within the second zigzag of primary wave Y.
Within intermediate wave (C) minor wave 3 has no Fibonacci ratio to minor wave 1. It is more likely then that minor wave 5 will exhibit a Fibonacci ratio to either of minor waves 1 or 3. At 14,658 minor wave 5 would reach 1.618 the length of minor wave 1.
Within minor wave 5 minute waves i, ii and iii are likely to be complete. Minute wave iii was just 10.89 points longer than 1.618 the length of minute wave i.
Minute wave iv is unlikely to be complete. It may last another one or two sessions. Minute wave iv may not move into minute wave i price territory. This wave count is invalidated with movement below 14,149.15.
I have drawn the parallel channel first with a trend line from the highs of minor waves 1 to 3 and pushed this line out to sit on the high of minute wave iii within minor wave 3. A parallel channel is placed upon the low of minor wave 4. Price may remain contained within this channel while the trend remains upwards. When this channel is clearly breached with downwards movement we shall have an early indication of a possible trend change.
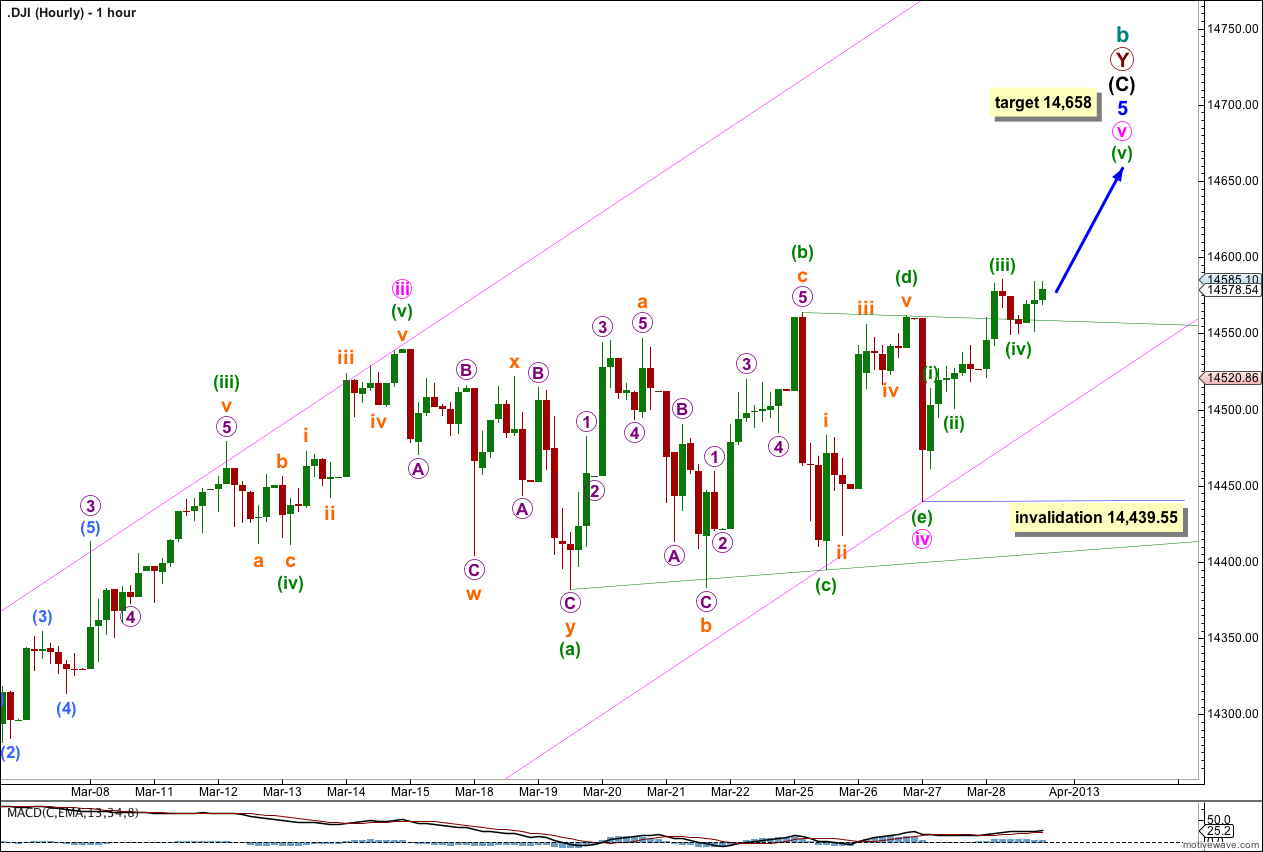
This hourly wave count shows the final structure of the triangle. It is a running barrier triangle with the B-D trend line essentially flat.
Within a triangle one of the subwaves should be longer lasting and more complicated than the other four subwaves. Minuette wave (a) fulfils this requirement as a double zigzag.
Within a triangle four of the five subwaves must subdivide into zigzags or zigzag multiples. Four of these waves do, and the fifth wave minuette wave (d) is an impulse.
Minute wave v would have begun at 14,439.55. The only question now for this hourly wave count is the degree of labeling within minute wave v. It may be that minuette waves (i) through to (iv) are already complete, or we may move the degree of labeling within minute wave v down one degree and minuette wave (i) may be incomplete.
No second wave correction within this final fifth wave may move beyond the start of its first wave. This wave count is invalidated with movement below 14,439.55.
Draw a parallel channel about minor wave 5. Draw the first trend line from the low of minute wave ii, which you can see on the daily chart, to the end of the triangle for minute wave iv. Place a parallel copy upon the high of minute wave iii. We may expect minute wave v to end either midway within the channel or about the upper edge. When this channel is breached by subsequent downwards movement this may be the first indication of a possible trend change.