
Downwards movement invalidated the main hourly wave count and confirmed the alternate. The correction was incomplete.
I have the same daily wave count for you, with a new alternate to consider.
For the main wave count I have two hourly wave counts. We may use confirmation / invalidation points to work with alternates until the situation is clearer.
Click on the charts below to enlarge.
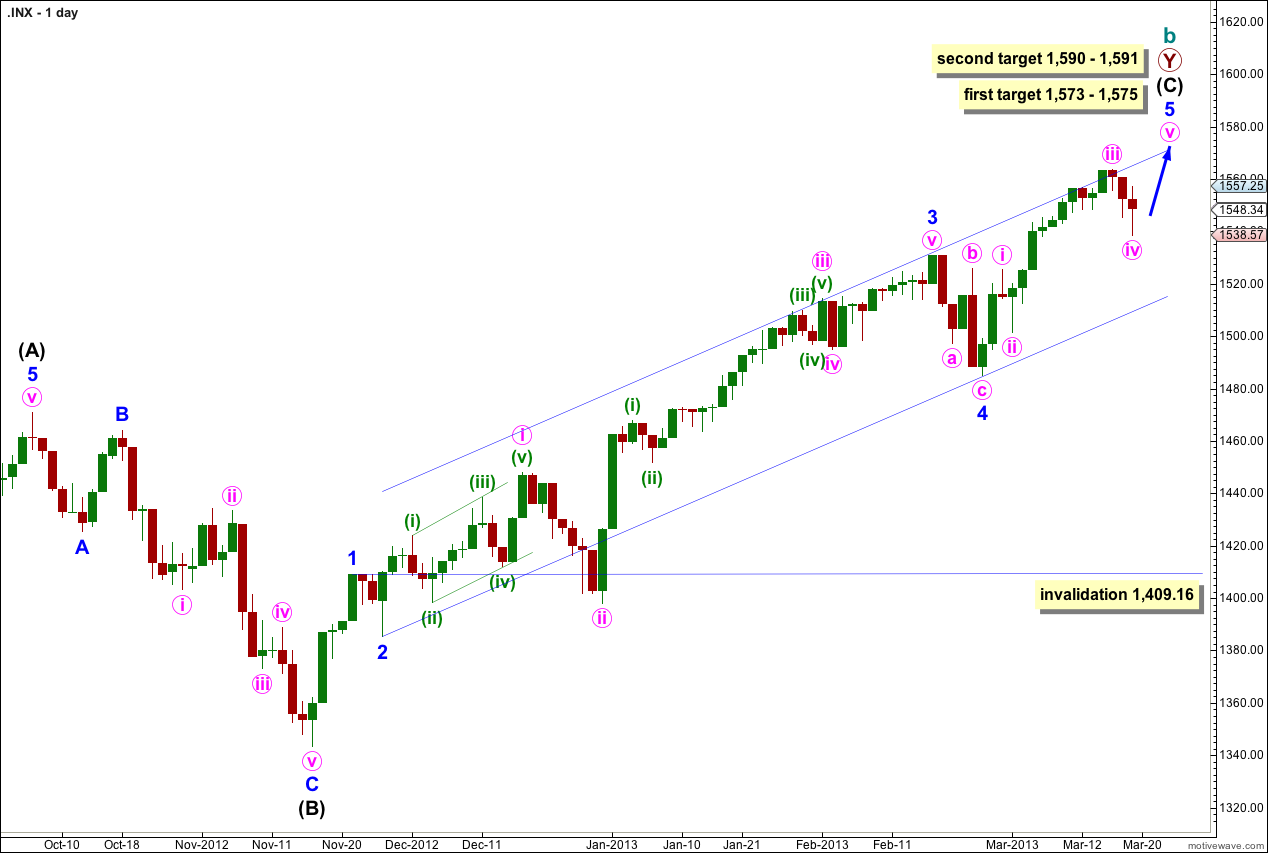
The structure is within the second zigzag of a double labeled primary wave Y. Within this second zigzag intermediate wave (C) may be incomplete.
Within intermediate wave (C) minor waves 1 through to 4 are most likely complete. We may use Elliott’s channeling technique to draw a channel about the impulse of intermediate wave (C). Draw the first trend line from the lows of minor waves 2 to 4, then place a parallel copy upon the high of minor wave 3. At this stage it looks like minor wave 5 may end about the upper edge of this channel.
At 1,573 cycle wave b would reach 105% the length of cycle wave a. This is the minimum requirement for a B wave in relation to an A wave within an expanded flat, and as expanded flats are the most common type of flat this price point has a good probability of being reached.
At 1,575 minor wave 5 would reach 0.618 the length of minor wave 3.
If price continues to move higher through the first target then we may use the second target. At 1,590 intermediate wave (C) would reach 0.618 the length of intermediate wave (A). At 1,591 minor wave 5 would reach 1.618 the length of minor wave 1. This gives us a high probability two point target based upon three wave degrees.
Within intermediate wave (C) minor wave 4 may not move into minor wave 1 price territory. This wave count is invalidated with movement below 1,409.16.
Within intermediate wave (C) minor wave 1 has no Fibonacci duration lasting 4 days, minor wave 2 lasted a Fibonacci 3 days, minor wave 3 lasted a Fibonacci 55 days, and minor wave 4 lasted a Fibonacci 5 days. So far minor wave 5 has lasted 15 days and may be incomplete. A possible end may be at a Fibonacci 21 days which will be in another 6 sessions. If it does not end there then a further 13 sessions would take it to a Fibonacci 34. At each Fibonacci time duration I will look at the structure to see if it could be complete and if so we shall have an alternate wave count for that possibility.
At intermediate degree wave (C) has so far lasted 82 sessions. In another 7 sessions it will have lasted a Fibonacci 89.
The most likely end to this trend may be 27th March, 2013 (give or take one day either side). However, Fibonacci time relationships are not always reliable. This is a guideline only.
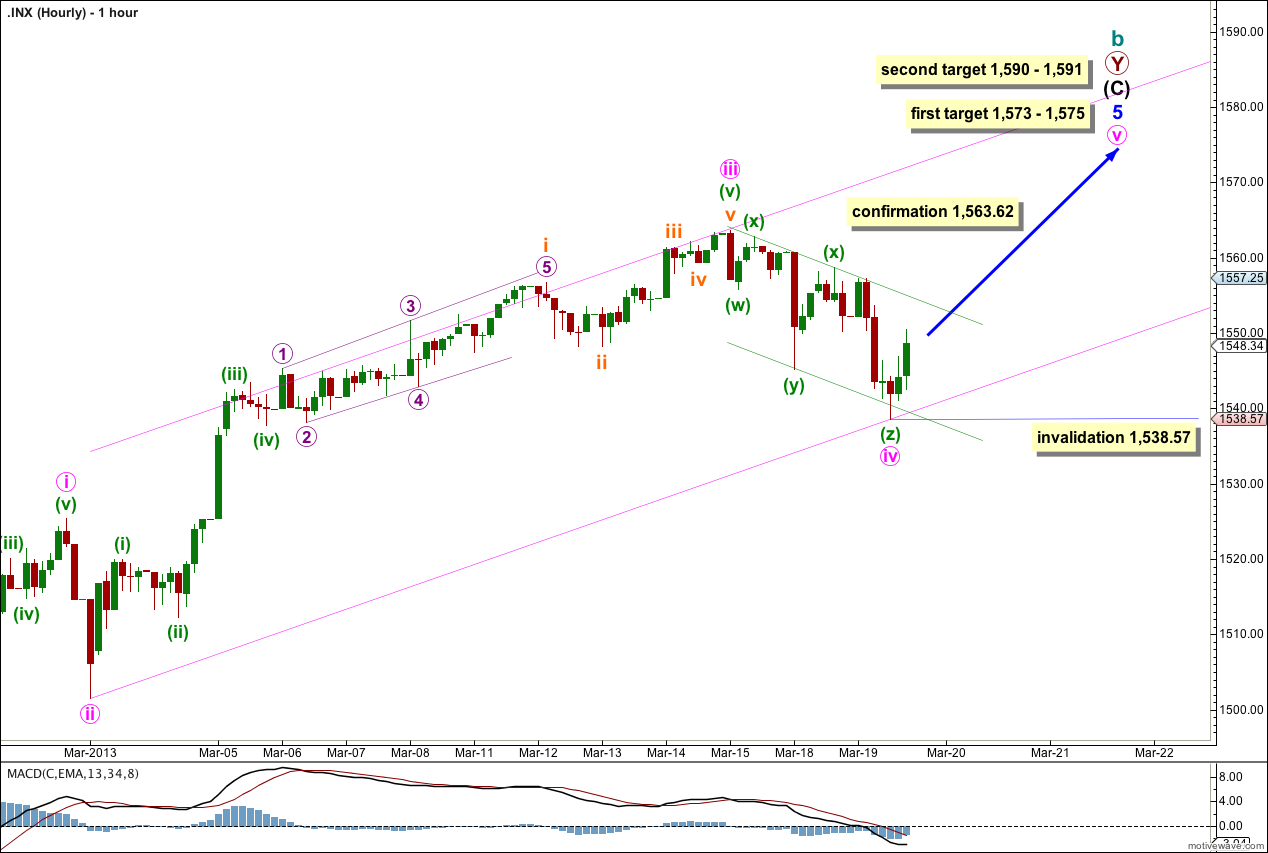
Minute wave iv may have just completed a rare triple zigzag. The subdivisions fit perfectly on the five minute chart and the structure moved price lower so the purpose of a triple zigzag is achieved. If minute wave iv is over here it is reasonably in proportion to minute wave ii and achieves nice alternation.
Minute wave iii is 3.11 points short of 1.618 the length of minute wave i so I would not expect to see a Fibonacci ratio between minute wave v and either of i or iii. Other wave degrees would be more reliable to find targets.
I have redrawn the parallel channel about minor wave 5 using Elliott’s second channeling technique. Draw the first trend line from the lows of minute waves ii to iv, then place a parallel copy upon the high of minute wave iii. Minute wave v may end either mid way or about the upper edge of the channel. When the channel is breached by subsequent downwards movement we shall have a very early indication that we may have seen a trend change.
Movement above 1,563.62 would invalidate the alternate below and confirm this main hourly wave count. At that stage expect further upwards movement to at least 1,573.
Within minor wave 5 no second wave correction may move beyond the start of the first wave. This wave count is invalidated with movement below 1,538.57.
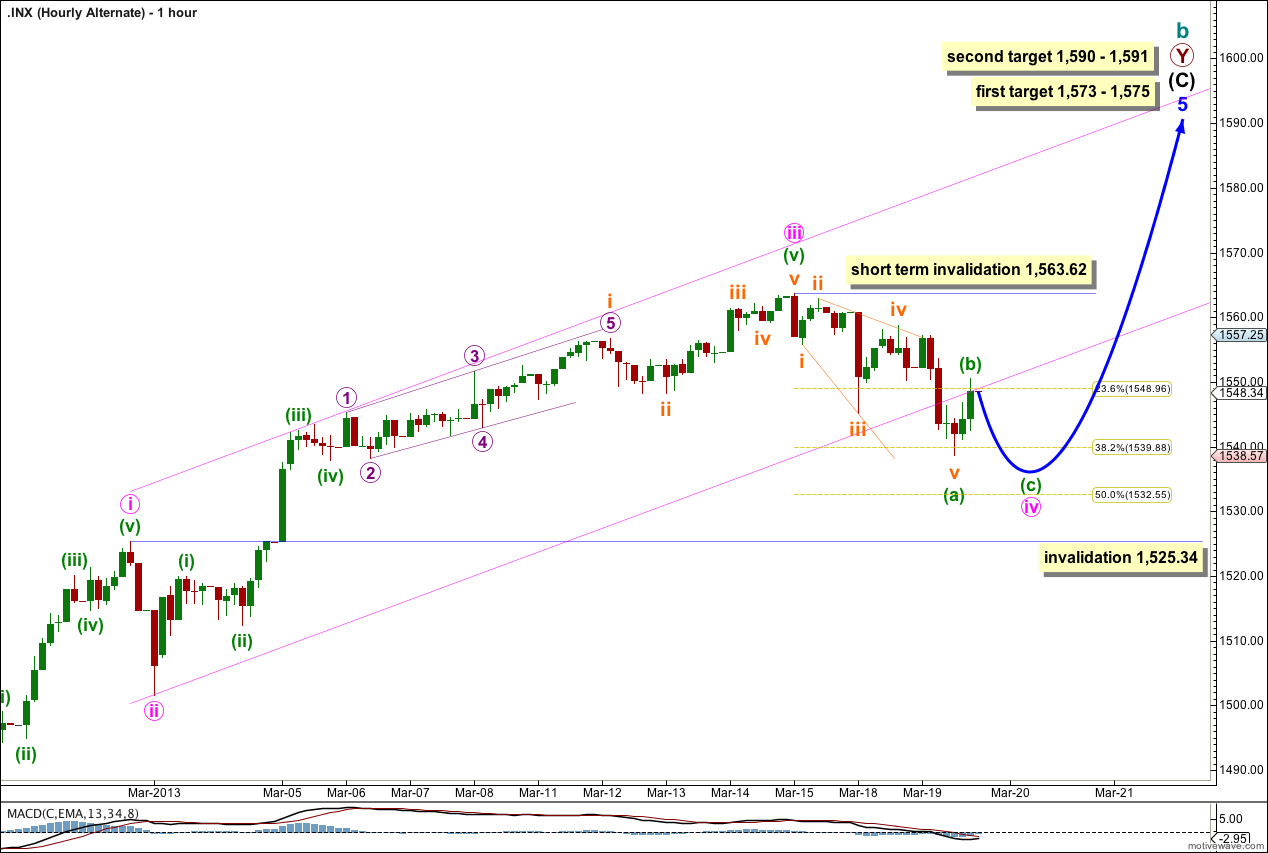
Alternatively, minute wave iv may be incomplete as a single zigzag with minuette wave (a) a leading expanding diagaonl. The subdivisions for a diagonal are the same as for a triple zigzag.
This alternate looks less likely for two reasons. The duration of minute wave iv is too far out of proportion to minute wave ii. There would be little alternation in structure between minute waves ii and iv.
Within a zigzag minuette wave (b) may not move beyond the start of minuette wave (a). This wave count is invalidated in the short term with movement above 1,563.62, prior to minuette wave (c) downwards completing.
Minute wave iv may not move into minute wave i price territory. This wave count is invalidated with movement below 1,525.34.
If this wave count is invalidated with downwards movement we may consider the alternate daily wave count below, but it would not be confirmed.
Alternate Daily Wave Count.
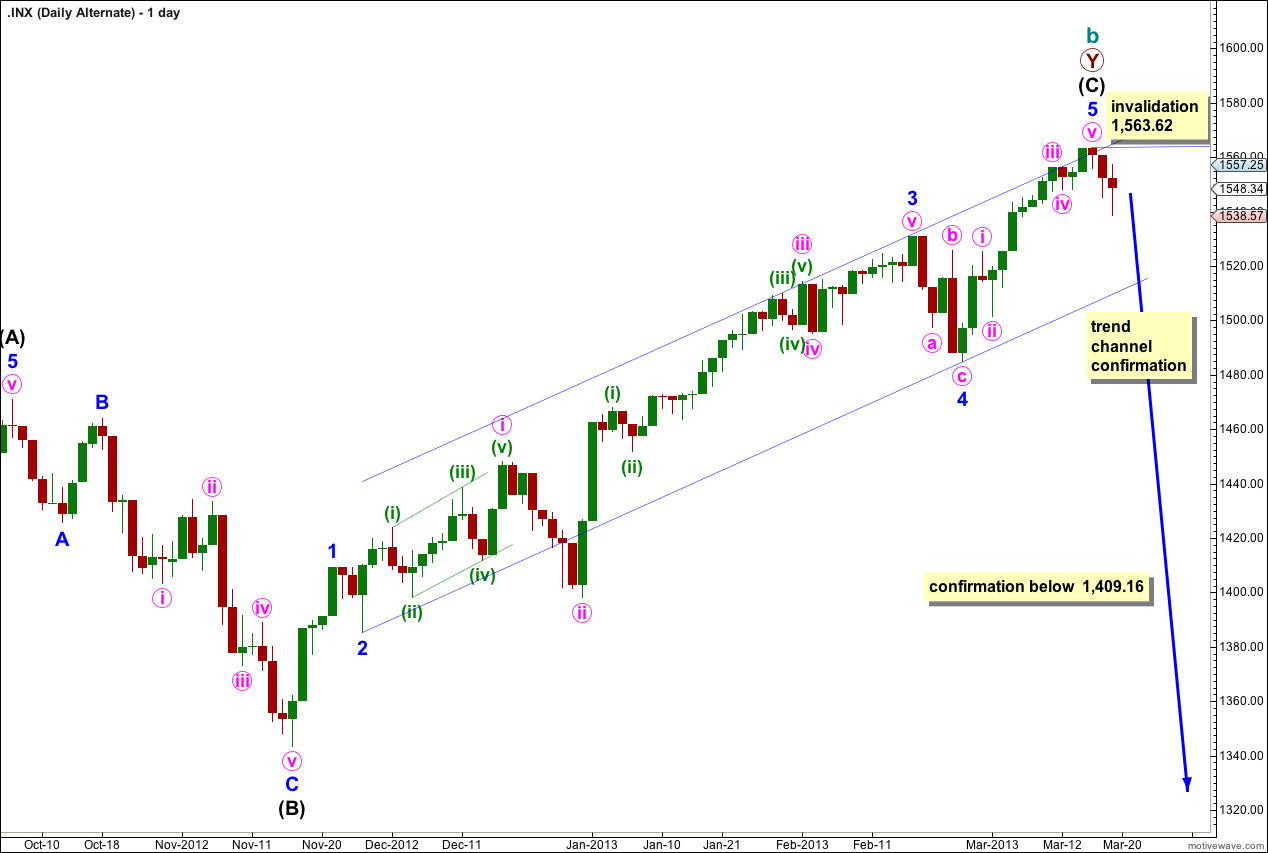
Again we must consider the possibility that we have seen a trend change at cycle degree a few days ago.
Cycle wave b lasting 48 months has no Fibonacci time relationship.
Within cycle wave b primary wave W has no Fibonacci time relationship, primary wave X lasted a Fibonacci 5 months, and primary wave Y has no Fibonacci time relationship.
Within primary wave Y no waves at intermediate degree have Fibonacci time relationships.
Within intermediate wave (C) minor wave 1 has no Fibonacci time relationship, minor wave 2 lasted a Fibonacci 3 days, minor wave 3 lasted a Fibonacci 55 days, minor wave 4 lasted a Fibonacci 5 days and minor wave 5 may have lasted a Fibonacci 13 days.
Cycle wave b would be only a 104% correction of cycle wave a, so the structure at super cycle degree would be a regular flat correction.
There is no Fibonacci ratio between intermediate waves (A) and (C).
Within intermediate wave (C) there are no Fibonacci ratios between minor waves 1, 3 and 5.
Within minor wave 5 minute wave iii has no Fibonacci ratio to minute wave i, and minute wave v is just 0.03 points short of 0.382 the length of minute wave i.
We would need to see movement below the blue parallel channel about intermediate wave (C) to have a little confidence in this wave count. At this stage it is just a possibility to be aware of; we have zero confirmation of a trend change.
We should always assume the trend remains the same until proven otherwise. At this stage we should assume the trend remains upwards, until we have confirmation that it has changed.
Any movement above 1,563.62 immediately invalidates this wave count and would give us more confidence in the targets on the main wave count.
Movement below 1,409.16 would provide confidence in a trend change. At that stage downwards movement could not be just a fourth wave correction within the last upwards wave, and so intermediate wave (C) would have to be over.