
Yesterday’s analysis expected more downwards movement with a couple of small fourth wave corrections along the way.
We did see a new low during Tuesday’s session, and two small fourth wave corrections have unfolded. Targets were too low though and have been recalculated.
At this stage the main and alternate wave counts do not diverge yet.
Click on the charts below to enlarge.
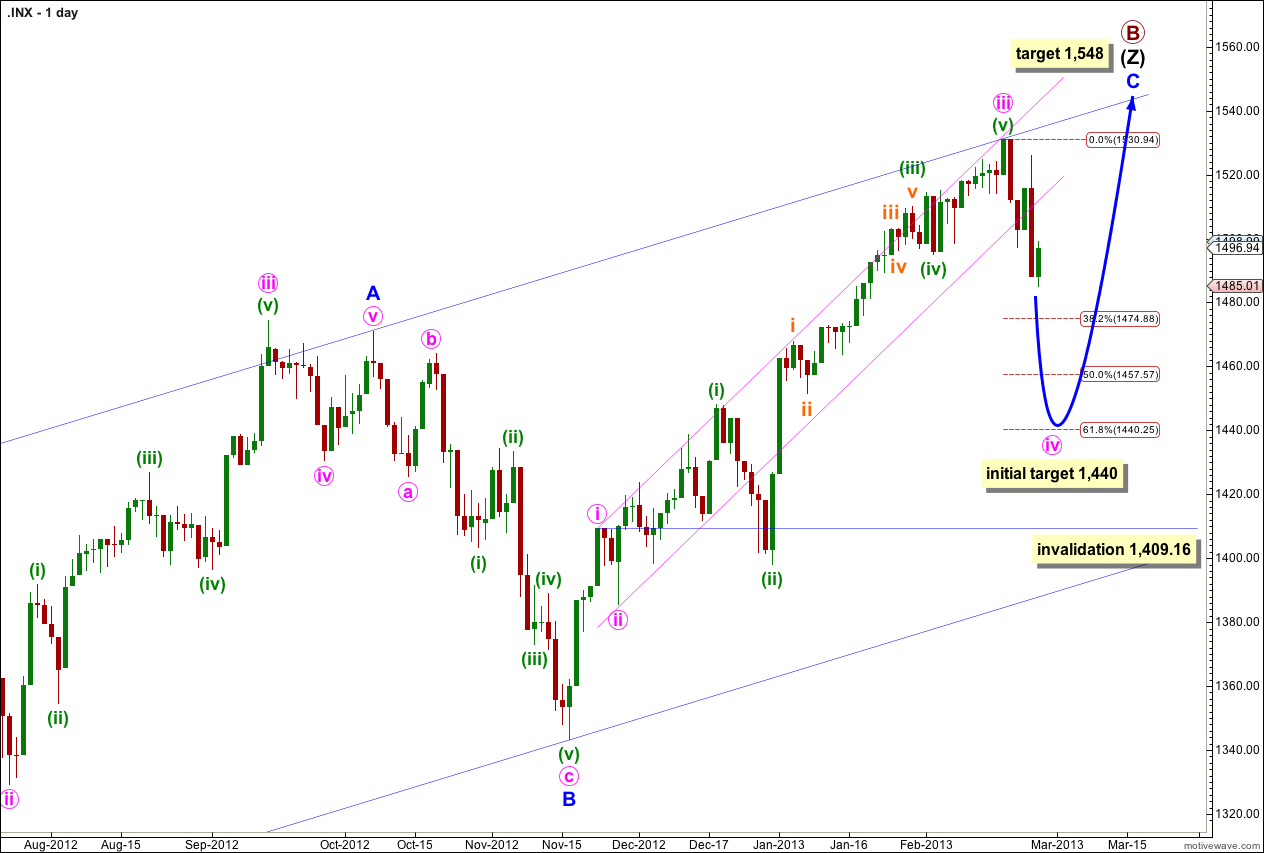
Wave iv pink should exhibit choppy overlapping downwards movement for about a week.
Because wave ii pink was a shallow 36% correction of wave i pink then wave iv pink may end about 1,440 at 0.618 the length of wave iii pink, given the guideline of alternation. Now that price has breached the narrow channel containing wave C blue it looks like we may see alternation in depth as well as structure.
Wave ii pink was a zigzag so we may expect wave iv pink to be a flat, double or triangle. A flat is most likely.
The most common type of flat is an expanded flat which has a B wave that makes a new price extreme beyond the end of the A wave. A new high above 1,530.94 is possible if wave iv pink unfolds as a flat.
If wave iii pink is over it lasted a Fibonacci 55 days. Within it wave (i) green lasted 14 days, one more than a Fibonacci 13, wave (ii) green lasted a Fibonacci 8 days, wave (iii) green lasted 20 days, one less than a Fibonacci 21, wave (iv) green lasted a Fibonacci 3 days, and wave (v) green may have had no Fibonacci duration. So far wave iv pink has lasted five days.
This main wave count expects wave iv pink to last about a week or so. Thereafter, wave (v) pink may move price to a new high (although it does not have to) and may end again on the upper edge of the wider parallel channel containing the zigzag of wave (Z) black.
At 1,548 wave C blue would reach equality in length with wave A blue. When wave iv pink is complete I will recalculate this target at pink degree.
Wave iv pink may not move into wave i pink price territory. This wave count is invalidated with movement below 1,409.16.
If this main wave count is invalidated then the alternate below will be strongly confirmed.
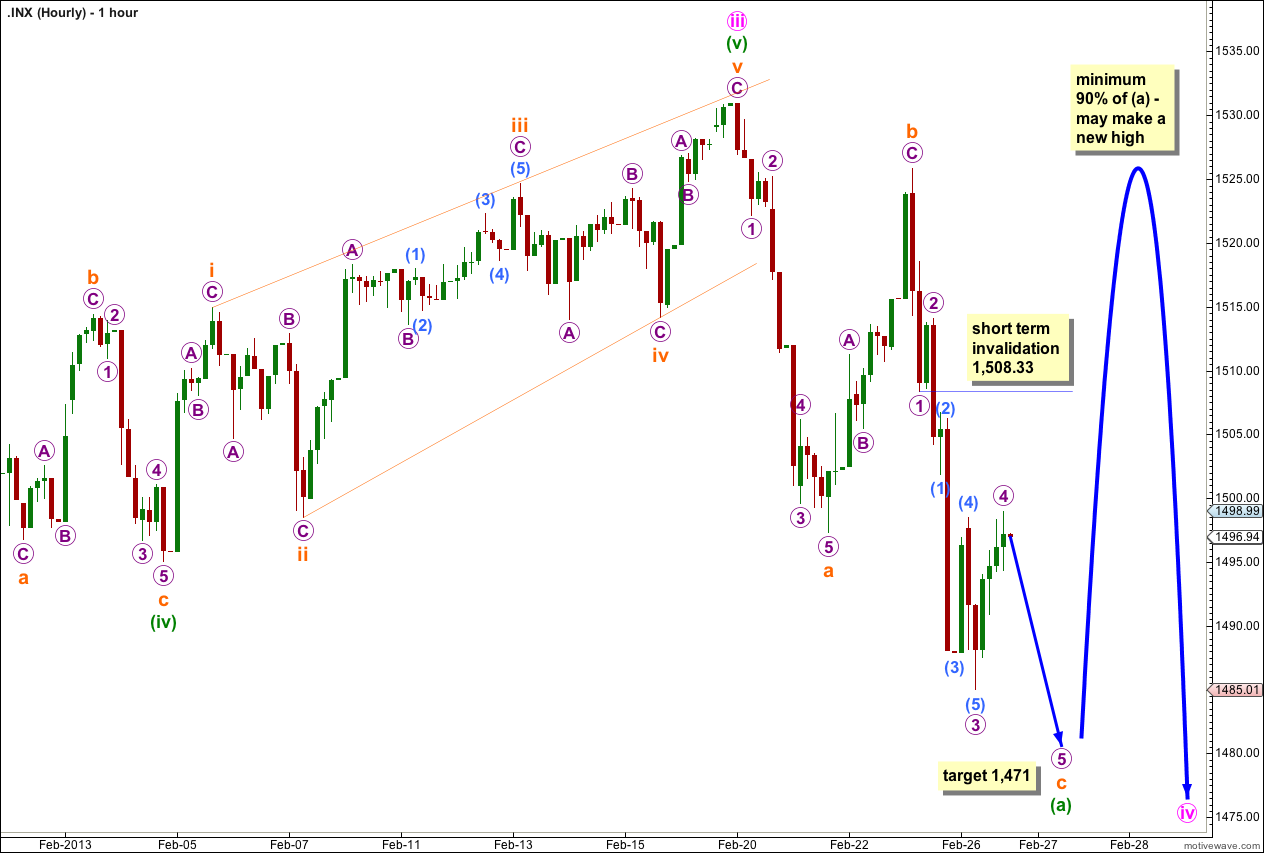
The middle of the third wave had completed at the end of Monday’s session. Tuesday began with a small fourth wave correction before price made a new low to complete wave (5) aqua and wave 3 purple.
Wave 3 purple is just 0.77 longer than 1.618 the length of wave 1 purple. I will not expect to see a Fibonacci ratio between wave 5 purple and either of 1 or 3.
At 1,471 wave c orange would reach 1.618 the length of wave a orange. That would complete a zigzag for wave (a) green within a possible flat correction for wave iv pink.
If wave iv pink is unfolding as a flat then wave (b) green must reach at least 90% the length of wave (a) green, and may make a new all time high. At that stage our wave counts diverge. Movement above 1,497.29 at that stage would invalidate the alternate and confirm this main wave count.
Alternate Wave Count.
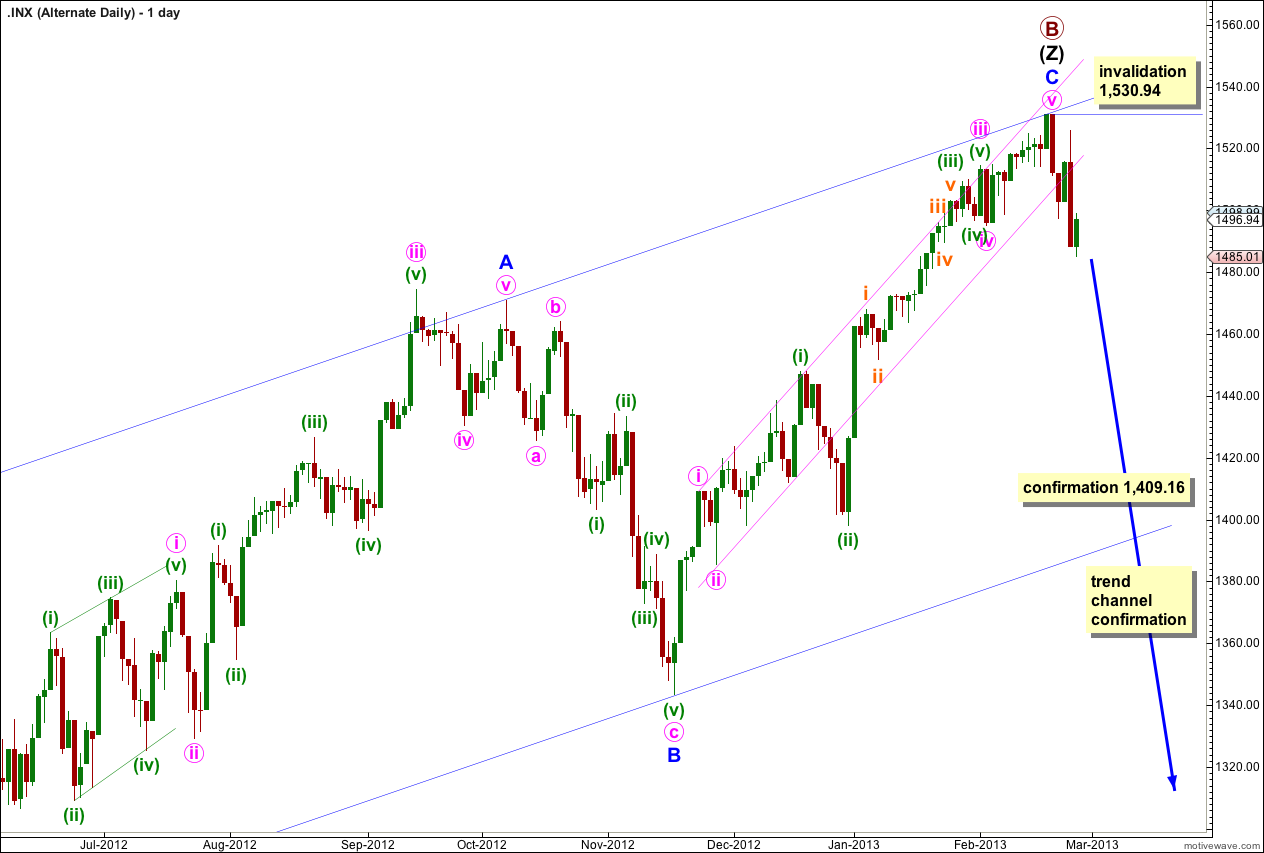
It is possible that we have seen a big trend change at primary wave degree. The bearish engulfing candlestick reversal pattern indicates a trend change and price may have bounced off the upper edge of the wider parallel channel.
If primary wave B triple zigzag is complete then it is a 160% correction of primary wave A. This is longer than the common length, so it is a bit unusual, but it is not unrealistic. I have seen B waves within flats that are this long.
We should always assume the trend remains the same, until proven otherwise. We should assume that the main wave count is correct, the trend remains upwards, until price moves below 1,409.16 to invalidate the main wave count. At that stage this alternate would be my only wave count and I will calculate downwards targets for you.
Further downwards movement below the parallel channel about the zigzag for wave (Z) black would provide confidence in this wave count.
Because primary wave B is a triple zigzag, and the maximum number of structures in a multiple is three, once the third zigzag is confirmed as complete then the entire correction must be complete. At cycle degree I cannot see another explanation for primary wave B which would allow for further upwards movement.
The increase in downwards momentum during Monday’s session gives a little indication that this alternate may be correct. So far it has a slightly better look on the hourly chart.
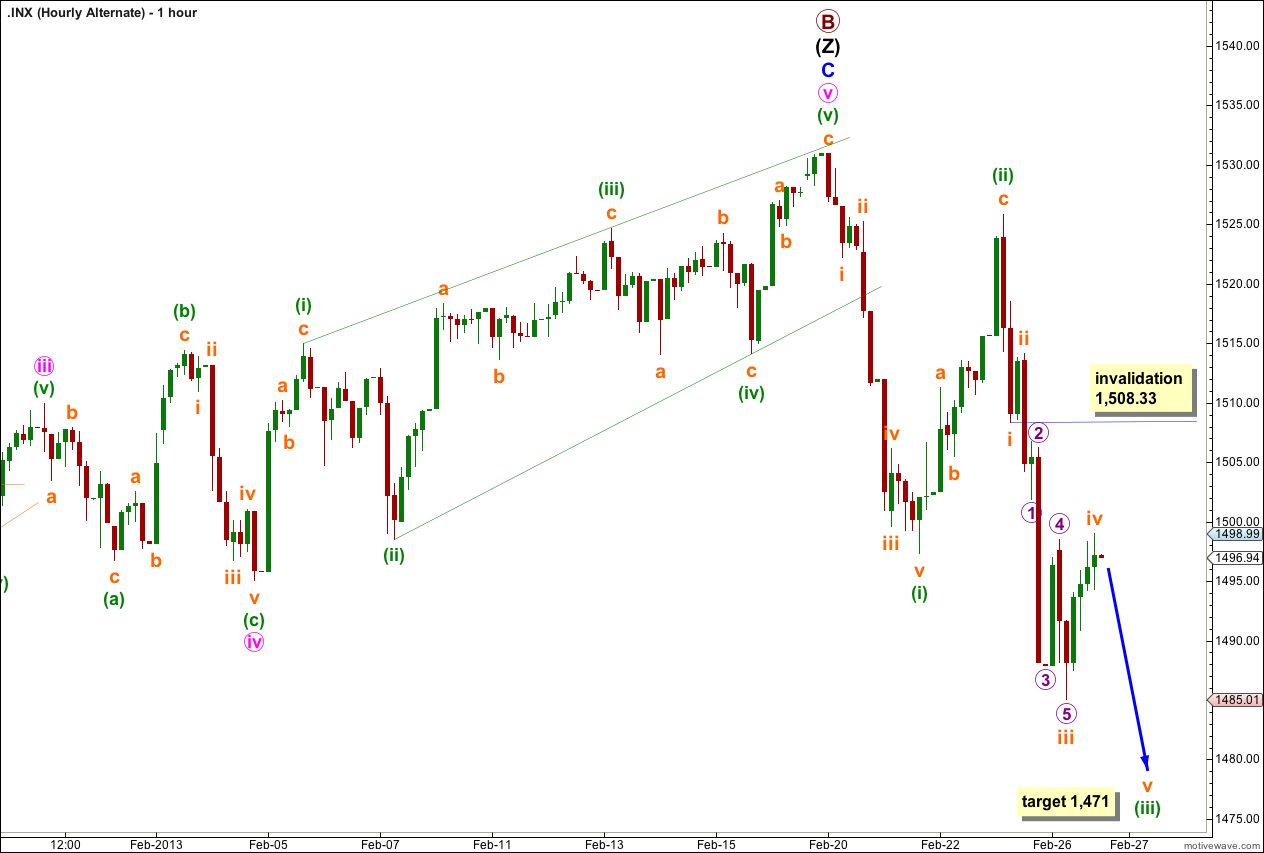
Targets have been recalculated.
Within green wave (iii) orange wave iii is just 0.77 longer than 1.618 the length of orange wave i, so orange wave v may not exhibit a Fibonacci ratio to either of orange waves i or iii. Green wave degree would then be a more reliable way to find an accurate target. At 1,471 green wave (iii) would reach 1.618 the length of green wave (i).
When green wave (iii) is complete then the following green wave (iv) may not move back into green wave (i) price territory. At that stage the wave counts diverge and this alternate would be invalidated with movement above 1,497.29.
For the next session or so if wave iv orange moves higher then it may not move into wave i orange price territory. This wave count is invalidated with movement above 1,508.33.
One more big NYMO move http://scharts.co/ZBsKSh
1525 then into 1570 for the Cherry Top