
Price has moved lower invalidating both the main and alternate wave counts.
I have two daily wave counts today. We can see a clear bearish engulfing candlestick reversal pattern on the daily chart. The question is whether this reversal is a short term correction or the start of a new trend. How low will it go?
Click on the charts below to enlarge.
Main Wave Count.
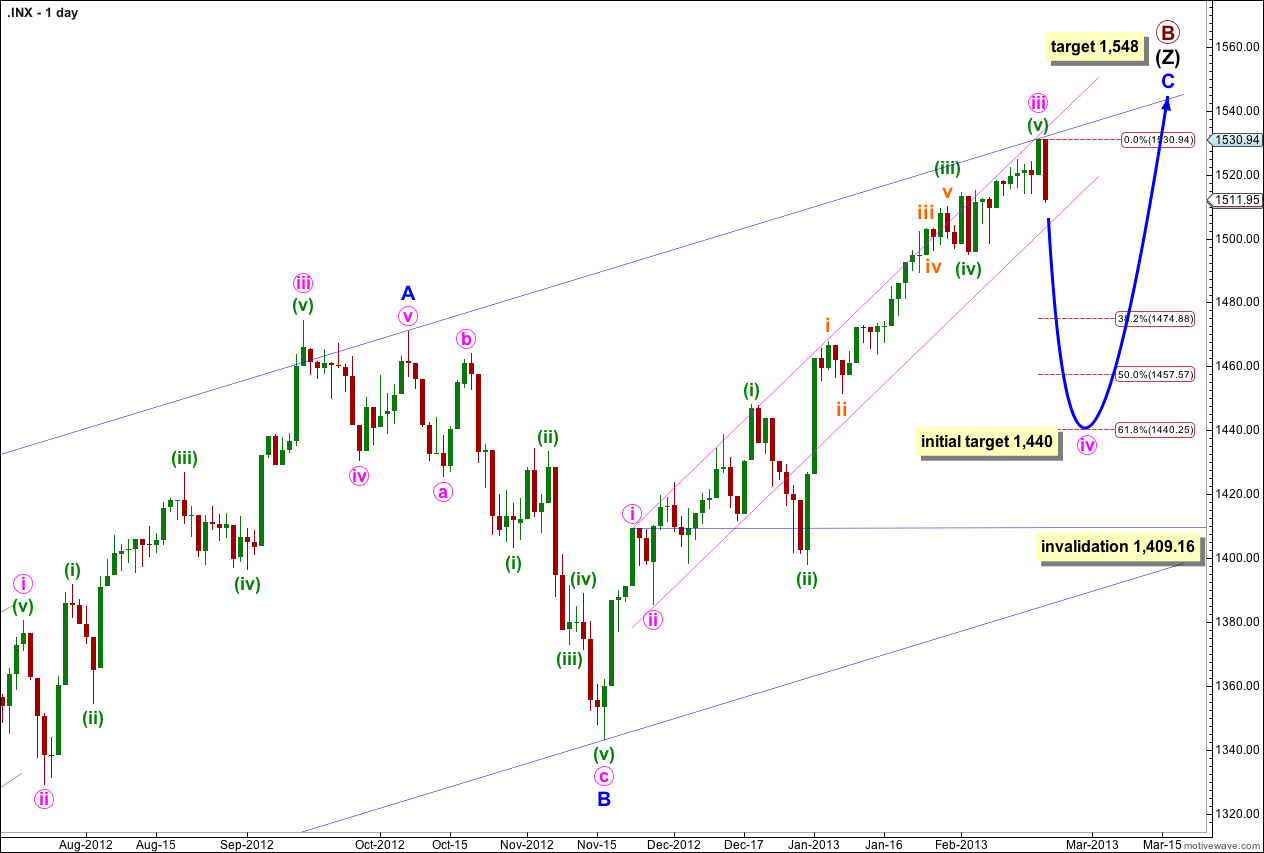
It seems clear that wave iii pink was already over at the high of 1,530.94. If this candlestick reversal pattern is the beginning of a deep fourth wave for iv pink we may expect choppy overlapping downwards movement for about a week.
Because wave ii pink was a shallow 36% correction of wave i pink then wave iv pink may end about 1,440 at 0.618 the length of wave iii pink, given the guideline of alternation. However, we may see alternation in structure and not depth. In the first instance I would look out for support at the lower end of the parallel channel drawn about wave C blue.
Wave ii pink was a zigzag so we may expect wave iv pink to be a flat, double or triangle. A flat is most likely.
The most common type of flat is an expanded flat which has a B wave that makes a new price extreme beyond the end of the A wave. A new high above 1,530.94 is possible if wave iv pink unfolds as a flat.
If wave iii pink was over on Friday it lasted a Fibonacci 55 days. Within it wave (i) green lasted 14 days, one more than a Fibonacci 13, wave (ii) green lasted a Fibonacci 8 days, wave (iii) green lasted 20 days, one less than a Fibonacci 21, wave (iv) green lasted a Fibonacci 3 days, and wave (v) green may have had no Fibonacci duration.
This main wave count expects wave iv pink to last about a week or so. Thereafter, wave (v) pink may move price to a new high (although it does not have to) and may end again on the upper edge of the wider parallel channel containing the zigzag of wave (Z) black.
At 1,548 wave C blue would reach equality in length with wave A blue. When wave iv pink is complete I will recalculate this target at pink degree.
Wave iv pink may not move into wave i pink price territory. This wave count is invalidated with movement below 1,409.16.
If this main wave count is invalidated then the alternate below will be strongly confirmed.
There are 13 possible Elliott wave corrective structures. At this early stage of this correction it is impossible to tell which structure will unfold. We can only say a flat is the most likely and will have to work with alternate wave counts as this correction continues this week.
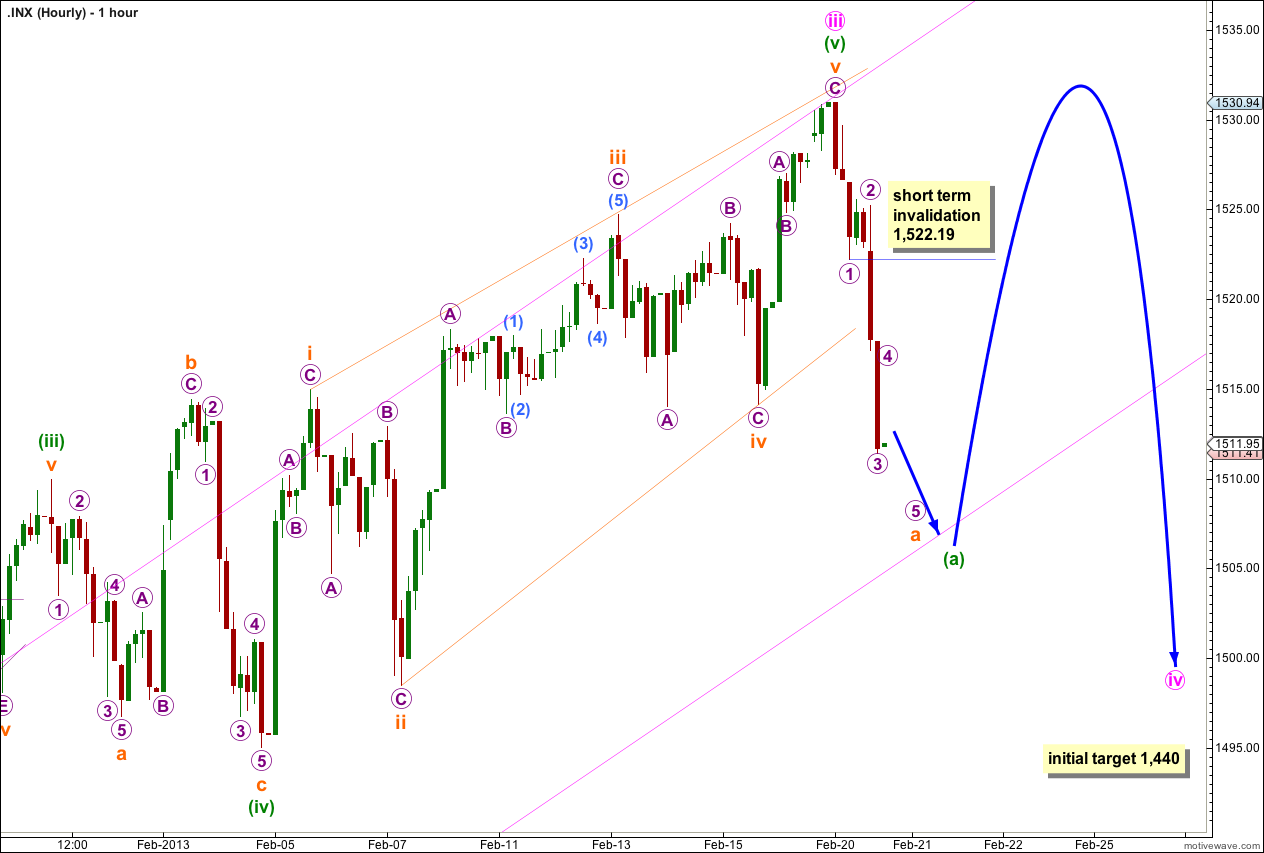
So far downwards movement may be the early stage of wave (a) green within wave iv pink. If wave iv pink is unfolding as a flat then wave (a) green should unfold as a three, most likely as a zigzag.
If wave (a) green is unfolding as a zigzag then wave a orange within it must unfold as a five wave structure and this looks so far to be an impulse. Within the impulse for wave a green wave 4 purple may not move into wave 1 purple price territory. This wave count is invalidated with movement above 1,522.19.
We may expect a small amount of upwards movement for wave 4 purple during tomorrow’s session. Thereafter, more downwards movement likely to a new low for wave 5 purple would complete the impulse for wave a orange. At that stage the invalidation point for wave b orange moves to the start of wave a orange at 1,530.94.
Overall this wave count expects downwards movement for this week, but it will not be a clear fall and it will be choppy and overlapping with a B wave in the middle that may even make a new high. A new high for an expanded flat would confirm this main wave count and invalidate the alternate below.
Alternate Wave Count.
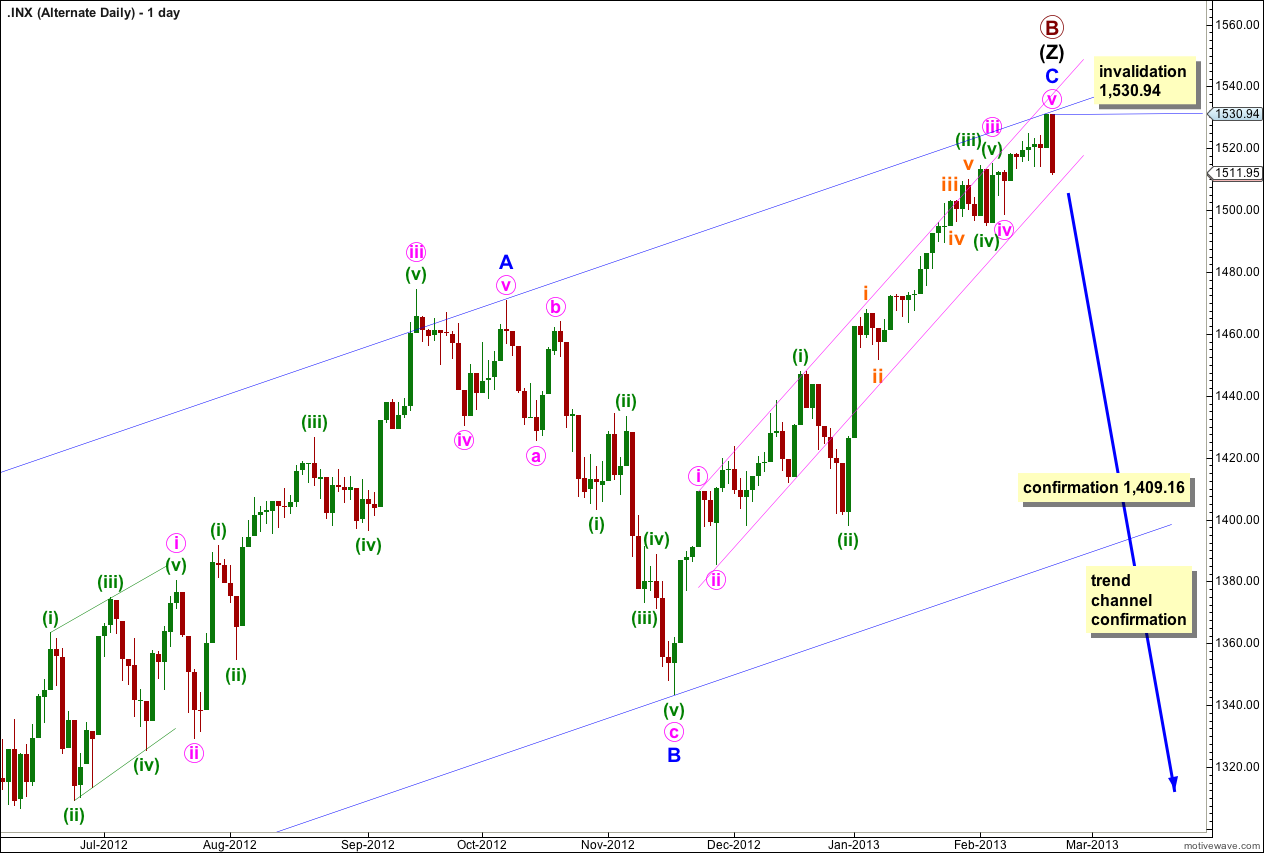
It is possible that we have seen a big trend change at primary wave degree on Friday. The candlestick reversal pattern indicates a trend change and price may have bounced off the upper edge of the wider parallel channel.
If primary wave B triple zigzag is complete then it is a 160% correction of primary wave A. This is longer than the common length, so it is a bit unusual, but it is not unrealistic. I have seen B waves within flats that are this long.
Within the zigzag of wave (Z) black wave C blue is 16.63 points short of equality with the (orthodox) length of wave A blue. This is an 8.8% variation (less than 10% is an acceptable ratio).
Ratios within wave (Z) black are: there is no Fibonacci ratio between waves i and iii pink, and wave v pink is just 1.88 points longer 0.236 the length of wave iii pink.
We should always assume the trend remains the same, until proven otherwise. We should assume that the main wave count is correct, the trend remains upwards, until price moves below 1,409.16 to invalidate the main wave count. At that stage we may consider this alternate seriously.
This alternate will be confirmed with a clear trend channel breach of Elliott’s channel. We need to see a full daily candlestick below this wide blue channel, and not touching the lower trend line, for confirmation. At that stage I would calculate a target for primary wave C downwards for you. To do so prior to confirmation would be premature.
This alternate is invalidated with any movement above 1,530.94.
If the main wave count is correct, and the most likely structure for wave iv pink an expanded flat unfolds, then we may have invalidation of this alternate with a new high.
Brother is telling me Wave 4 ended today (irregular flats) and Wave 5 of Major 3 will end back at 1553 or higher. – sorry no chart.
….very clear five waves down from 1531 to 1497
Yes, that five down is crystal clear.
The only question now is it an A wave of a correction, or is it a first wave of a new trend.