
Last analysis expected upwards movement to begin the new trading week, with an increase in upwards momentum. This is exactly what we have seen.
Price has come to touch the upper edge of our wide parallel channel on the daily chart. The question now is can this structure be complete? Will the upper edge of the channel provide resistance or will price overshoot the channel?
The daily wave count remains the same as does the main hourly. I have a new hourly alternate for you which has a lower probability than the main wave count.
Click on the charts below to enlarge.
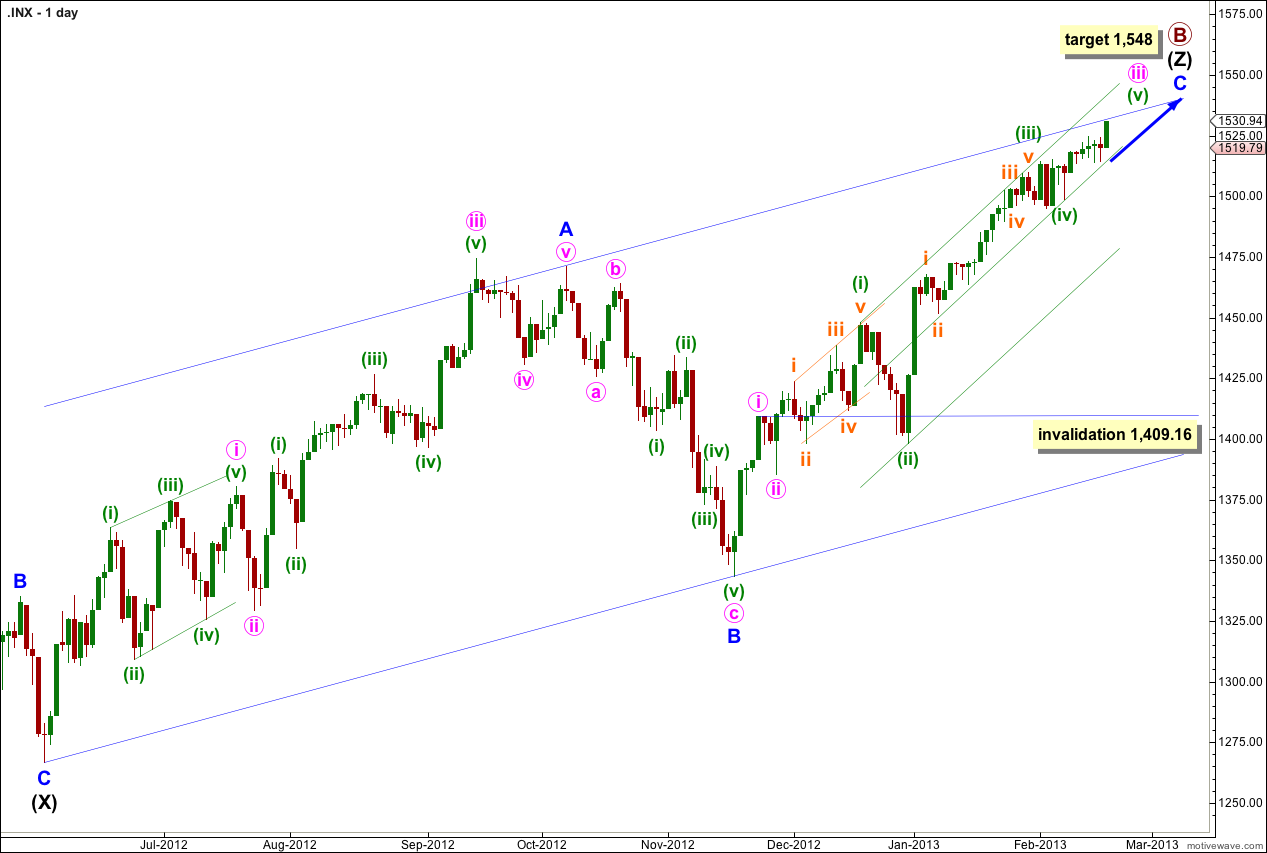
The structure for primary wave B is a triple zigzag. Because three is the maximum number of structures within a multiple when this third zigzag is finally complete then the entire correction for primary wave B must be complete. There is no other Elliott wave structure which could allow for upwards movement within this wave count at cycle degree.
Wave (Z) black is incomplete as an exaggerated zigzag and wave C blue within it is incomplete.
Within wave iii pink of wave C blue there are some interesting Fibonacci time relationships: wave (i) green lasted 14 days (one more than a Fibonacci 13), wave (ii) green lasted a Fibonacci 8 days, and wave (iii) green lasted 20 days (one less than a Fibonacci 21). Wave (iv) green may have been over in 6 days (not close enough for a Fibonacci relationship). So far wave (v) green may have lasted 7 days and considering how this structure is unfolding it may take a further 6 days to total a Fibonacci 13.
At 1,548 wave C blue would reach equality with wave A blue. At that point primary wave B would be a 166% correction of primary wave A. This target may be too high. When waves iii and iv pink are complete I will recalculate the target based upon pink wave degree.
I have used Elliott’s channeling technique to draw a channel about wave (Z) black zigzag. Price may find resistance at the upper edge of the channel. Sometimes C waves overshoot these channels a little prior to their end.
Within wave iii pink wave (iv) green may not move into wave (i) green price territory. This wave count is invalidated with movement below 1,448.
I have drawn a double wide channel about wave iii pink: draw the first trend line from the highs of waves (i) to (iii) green then place a parallel copy upon the low of wave (ii) green. Place a second parallel copy on the low of wave (iv) green. Price may remain within the upper half of the channel and may find resistance at the upper trend line.
Main Hourly Wave Count.
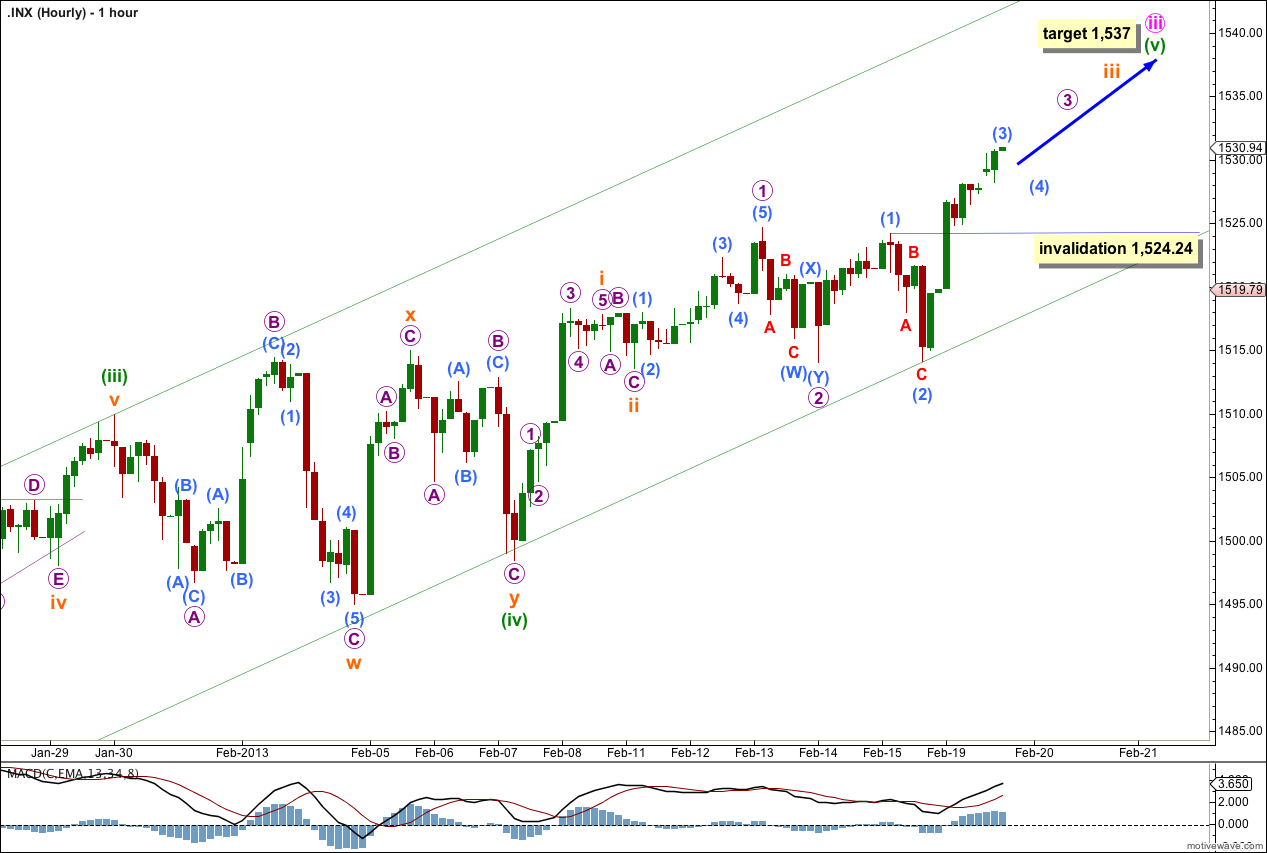
As expected finally momentum to the upside increased as indicated by MACD. This upwards movement for Tuesday’s session looks like the third wave we were waiting for.
The subdivisions of wave (3) aqua on the five minute chart look like it may have ended at the end of Tuesday’s session, although the fifth wave within it could extend a little further. Either way wave (4) aqua may have just begun or may begin very soon. Wave (2) aqua was a very deep zigzag structure so wave (4) aqua may be expected to be a shallow flat, triangle or double combination. It should last about half a session to a session.
Thereafter, further upwards movement is expected.
On the way up towards the target at 1,537 we are expecting three corrections: wave (4) aqua, wave 4 purple and wave iv orange. Only wave iv orange may be expected to be relatively deep, and the other two fourth waves should be relatively shallow and may be brief.
At 1,537 wave (v) green would reach 0.618 the length of wave (i) green. However, there is already a Fibonacci ratio at green degree between waves (i) and (iii) so we may not see a ratio between wave (v) green and either of (iii) or (i). When waves iii and iv orange within wave (v) green are complete I will use orange wave degree to recalculate this target, so it will change.
Wave (4) aqua may not move into wave (1) aqua price territory. This wave count is invalidated with movement below 1,524.24.
If this wave count is invalidated with downwards movement then we may use the alternate below.
Alternate Hourly Wave Count.
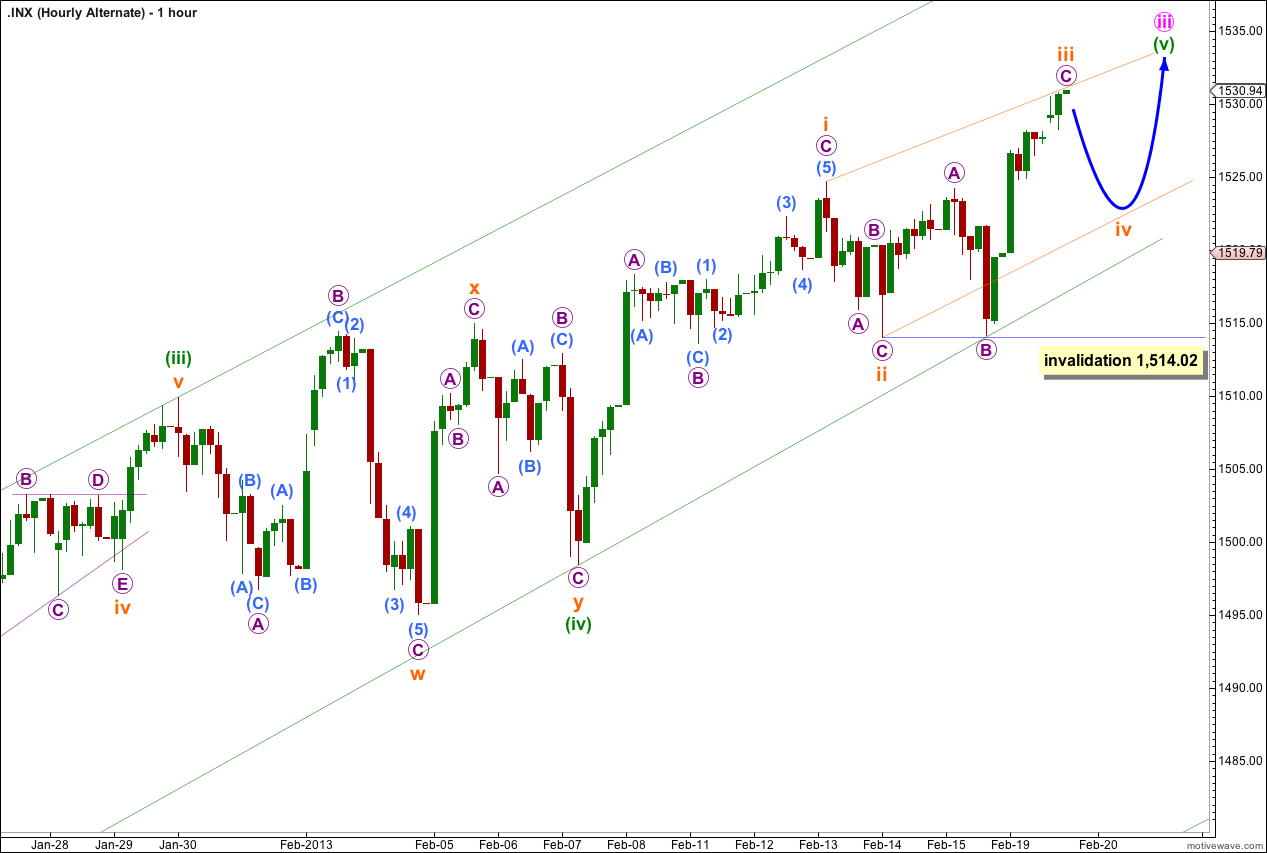
There are two structural possibilities for wave (v) green: an impulse as for the main hourly wave count, or an ending diagonal as for this alternate.
The ending diagonal may be contracting as wave iii orange is shorter than wave i orange.
Within an ending diagonal all subwaves must subdivide into zigzags. This wave count must see the wave labeled ii orange as a single zigzag. Because this movement is better seen as a double zigzag rather than a single, this reduces the probability that this wave count is correct.
Within a diagonal the fourth wave should overlap into the first wave price territory, but may not move beyond the end of the second wave. Wave iv orange may not move beyond the end of wave ii orange at 1,514.02.
When wave iv orange is complete then the final wave upwards for (v) orange may not be longer than 16.92 points.
There are two reasons why this wave count has a lower probability:
1. The structure of wave ii orange is problematic because it should be a single zigzag which does not have a good fit.
2. The depth of wave ii orange because it is a shallow 41% correction (second and fourth waves of diagonals are more commonly between 66% and 81% of the prior wave).
Hi Lara,
Will waves IV and V pink (circle) have to follow after wave III pink circle before we can see a trend change (end of wave B and Z (black))?
Yes, that would be correct.
I am expecting wave iv pink would be deep because ii pink was shallow. It could last about a week or so.
Wave v pink does not have to make a new high, but it’s likely it would.