
Last analysis expected more upwards movement. Price began the session by moving lower and remained above the short term invalidation point. Thereafter, it turned upwards as expected.
The wave count remains the same and I still have just the one daily and one hourly chart for you.
Click on the charts below to enlarge.
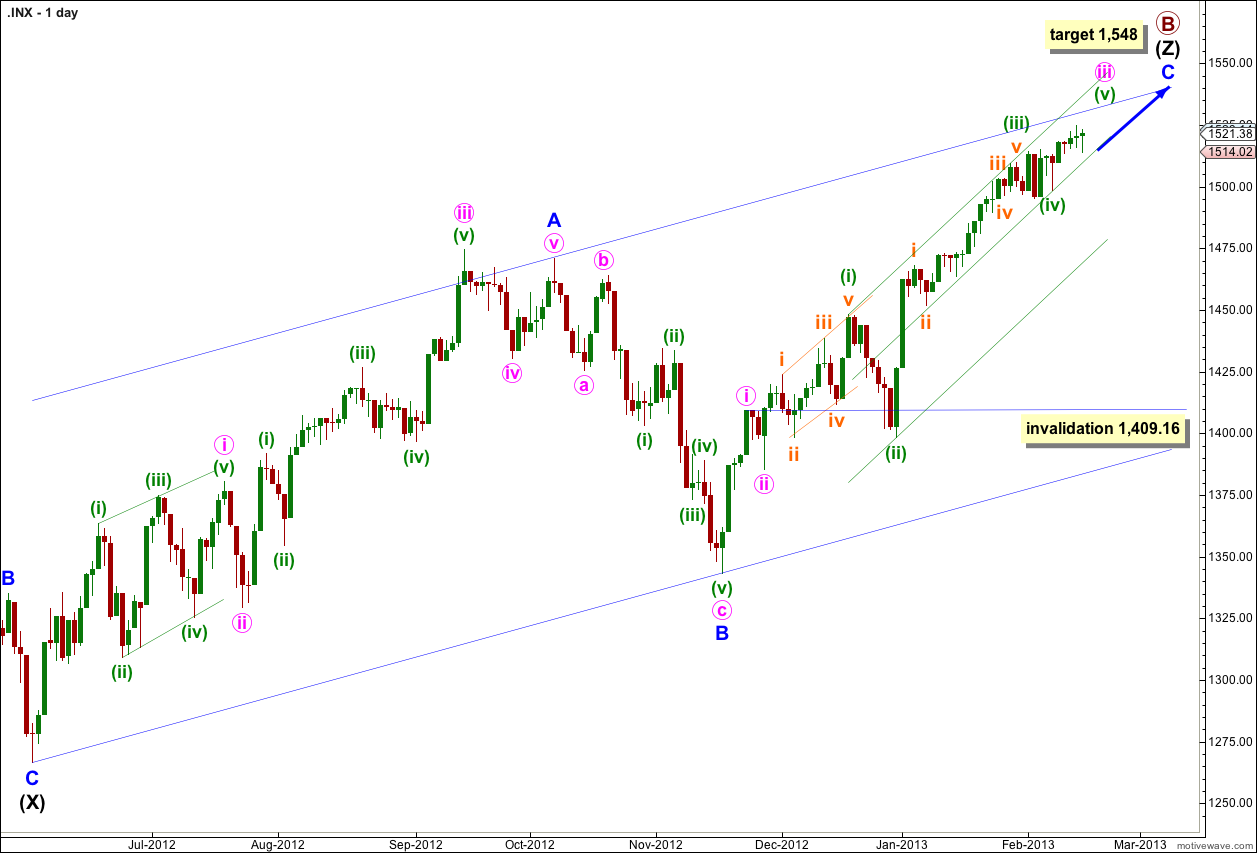
The structure for primary wave B is a triple zigzag. Because three is the maximum number of structures within a multiple when this third zigzag is finally complete then the entire correction for primary wave B must be complete. There is no other Elliott wave structure which could allow for upwards movement within this wave count at cycle degree.
Wave (Z) black is incomplete as an exaggerated zigzag and wave C blue within it is incomplete.
Within wave iii pink of wave C blue there are some interesting Fibonacci time relationships: wave (i) green lasted 14 days (one more than a Fibonacci 13), wave (ii) green lasted a Fibonacci 8 days, and wave (iii) green lasted 20 days (one less than a Fibonacci 21). Wave (iv) green may have been over in 6 days (not close enough for a Fibonacci relationship). So far wave (v) green may have lasted 5 days and considering how this structure is unfolding it may take another 3 days to total a Fibonacci 8, or a further 5 days to total a Fibonacci 13.
At 1,548 wave C blue would reach equality with wave A blue. At that point primary wave B would be a 166% correction of primary wave A. This target may be too high. When waves iii and iv pink are complete I will recalculate the target based upon pink wave degree.
I have used Elliott’s channeling technique to draw a channel about wave (Z) black zigzag. Price may find resistance at the upper edge of the channel.
Within wave iii pink wave (iv) green may not move into wave (i) green price territory. This wave count is invalidated with movement below 1,448.
I have drawn a double wide channel about wave iii pink: draw the first trend line from the highs of waves (i) to (iii) green then place a parallel copy upon the low of wave (ii) green. Place a second parallel copy on the low of wave (iv) green. Price may remain within the upper half of the channel and may find resistance at the upper trend line.
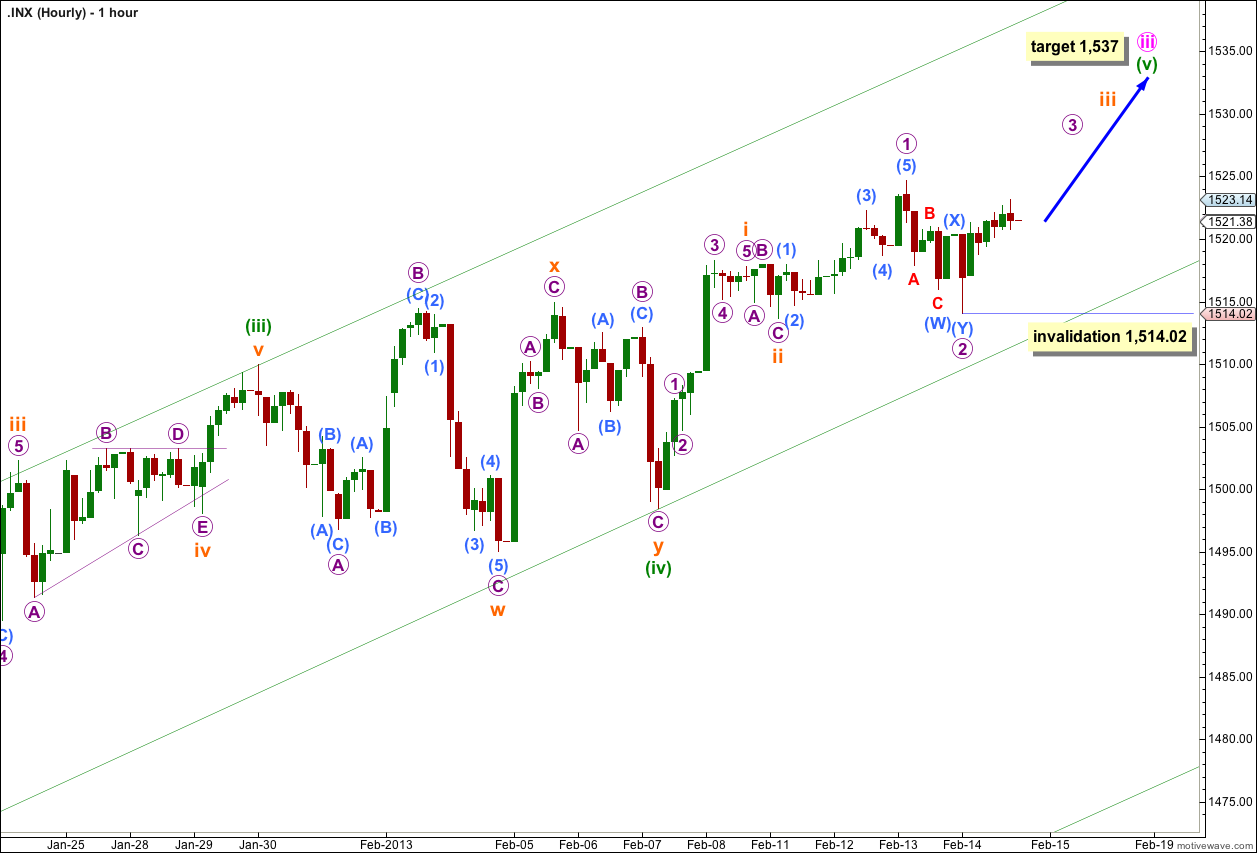
The session began with wave 2 purple moving lower as a double zigzag structure. Wave 2 purple is a very deep 96% correction of wave 1 purple, which is reasonably common, and so we may expect the upcoming fourth wave at purple degree to be relatively shallow.
If this wave count is correct then we must see an increase in upwards momentum next session. There is no more room to the downside for this second wave to move into and the third wave should take price higher tomorrow.
The short / mid term target at 1,537 is either three or eight sessions away. At 1,537 wave (v) green would reach 0.618 the length of wave (i) green.
Within wave 3 purple no second wave correction may move beyond the start of its first wave. This wave count is invalidated with movement below 1,514.02.
Bought Futures (/ES) 1512 Friday on the dip…. thanks for all your help this week.
Nice head fake or we are starting minor 3 down after the failed new high