
Yesterday’s analysis expected upwards movement from the S&P 500. We did see a new high, but price subsequently moved lower below the invalidation point on the hourly chart.
Overall the wave count remains mostly the same. I have moved the degree of labeling for most recent movement down one degree. The structure is unfolding mostly as expected and the target remains the same.
Click on the charts below to enlarge.
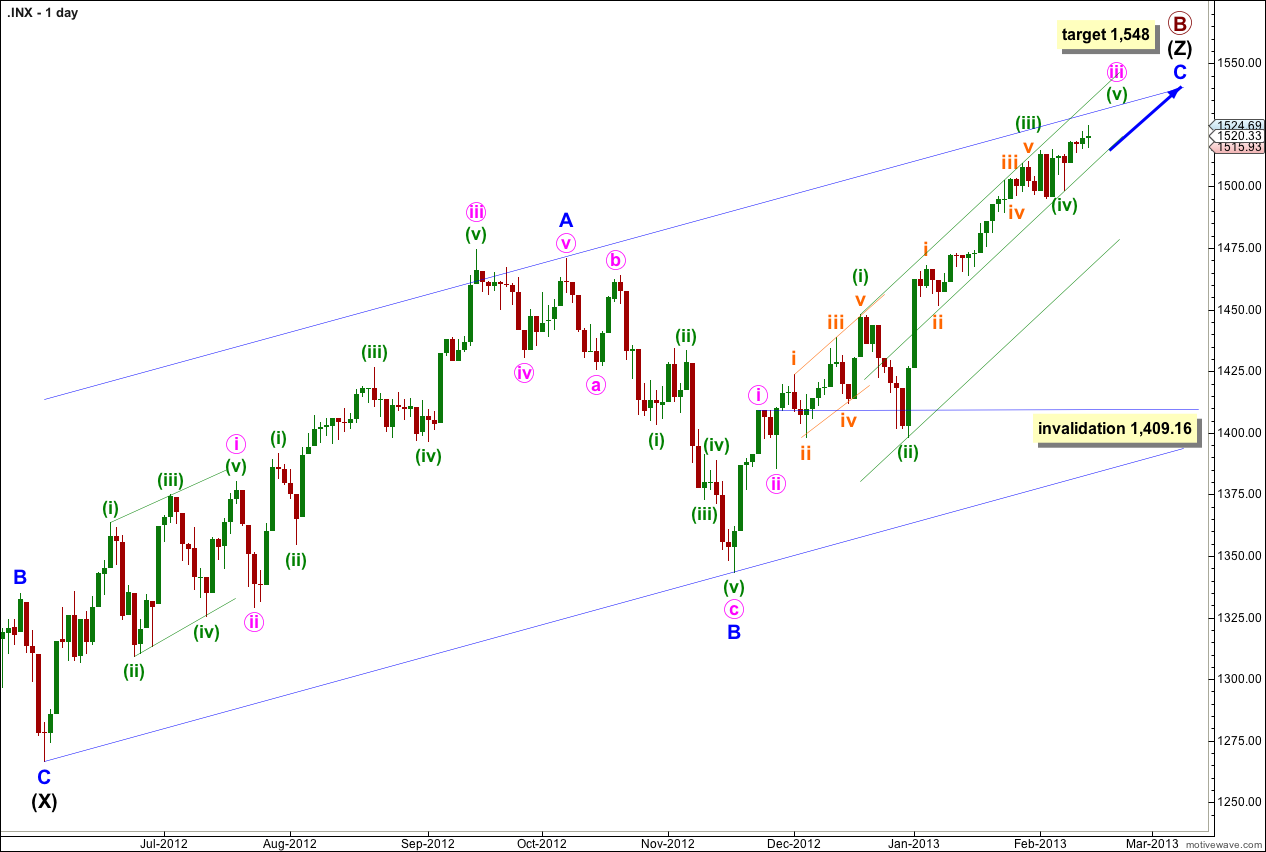
The structure for primary wave B is a triple zigzag. Because three is the maximum number of structures within a multiple when this third zigzag is finally complete then the entire correction for primary wave B must be complete. There is no other Elliott wave structure which could allow for upwards movement within this wave count at cycle degree.
Wave (Z) black is incomplete as an exaggerated zigzag and wave C blue within it is incomplete.
Within wave iii pink of wave C blue there are some interesting Fibonacci time relationships: wave (i) green lasted 14 days (one more than a Fibonacci 13), wave (ii) green lasted a Fibonacci 8 days, and wave (iii) green lasted 20 days (one less than a Fibonacci 21). Wave (iv) green may have been over in 6 days, not close enough for a Fibonacci relationship . So far wave (v) green may have lasted 4 days. Considering how this structure is unfolding it may take another 4 days to total a Fibonacci 8, or a further 5 days to total a Fibonacci 13.
At 1,548 wave C blue would reach equality with wave A blue. At that point primary wave B would be a 166% correction of primary wave A. This target may be too high. When waves iii and iv pink are complete I will recalculate the target based upon pink wave degree.
I have used Elliott’s channeling technique to draw a channel about wave (Z) black zigzag. Price may find resistance at the upper edge of the channel.
Within wave iii pink wave (iv) green may not move into wave (i) green price territory. This wave count is invalidated with movement below 1,448.
I have drawn a double wide channel about wave iii pink: draw the first trend line from the highs of waves (i) to (iii) green then place a parallel copy upon the low of wave (ii) green. Place a second parallel copy on the low of wave (iv) green. Price may remain within the upper half of the channel and may find resistance at the upper trend line.
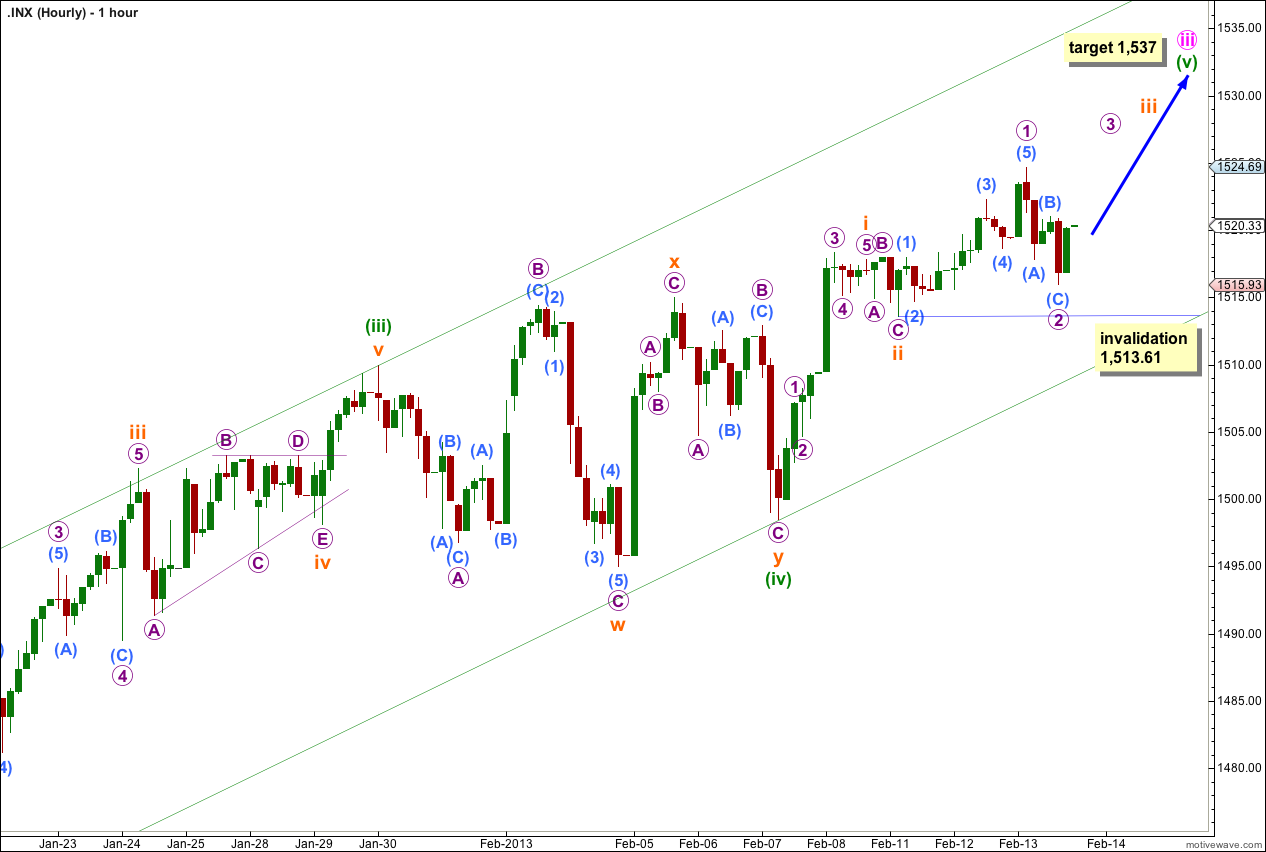
I have moved the degree of labeling within wave iii orange down one degree. The upwards impulse may have been only wave 1 purple within wave iii orange. Downwards movement which invalidated yesterday’s hourly wave count may have been wave 2 purple.
Upwards movement is clearly unfolding as five wave structures, and downwards movement is unfolding in threes. The trend remains upwards.
Ratios within wave 1 purple are: wave (3) aqua is 0.57 points longer than 1.618 the length of wave (1) aqua, and wave (5) aqua has no Fibonacci ratio to either of waves (1) or (3) aqua.
Within wave 2 purple waves (A) and (C) aqua have no Fibonacci ratio.
Movement above the high labeled wave (B) aqua at 1,520.99 would add confidence tomorrow that we should see a new high. At that stage the downwards structure labeled wave 2 purple would be confirmed as a three wave structure which is further indication that the trend is upwards.
If this analysis of recent movement is correct then we should see an increase in upwards momentum over the next one to two sessions as the middle of a third wave unfolds.
If wave 2 purple continues further sideways as a double combination then it may not move beyond the start of wave 1 purple. This wave count is invalidated with movement below 1,513.61.
Looks like we are going to drop to 1476 for Wave 4 then back up into 1581 http://scharts.co/12PbtFy